SMART Indicator Report: Zooplankton Diversity
1 Descriptive Section
1.3 Indicator brief description
Effective Shannon diversity calculated using 42 zooplankton taxa collected from EcoMon cruises
1.4 Indicator visualization
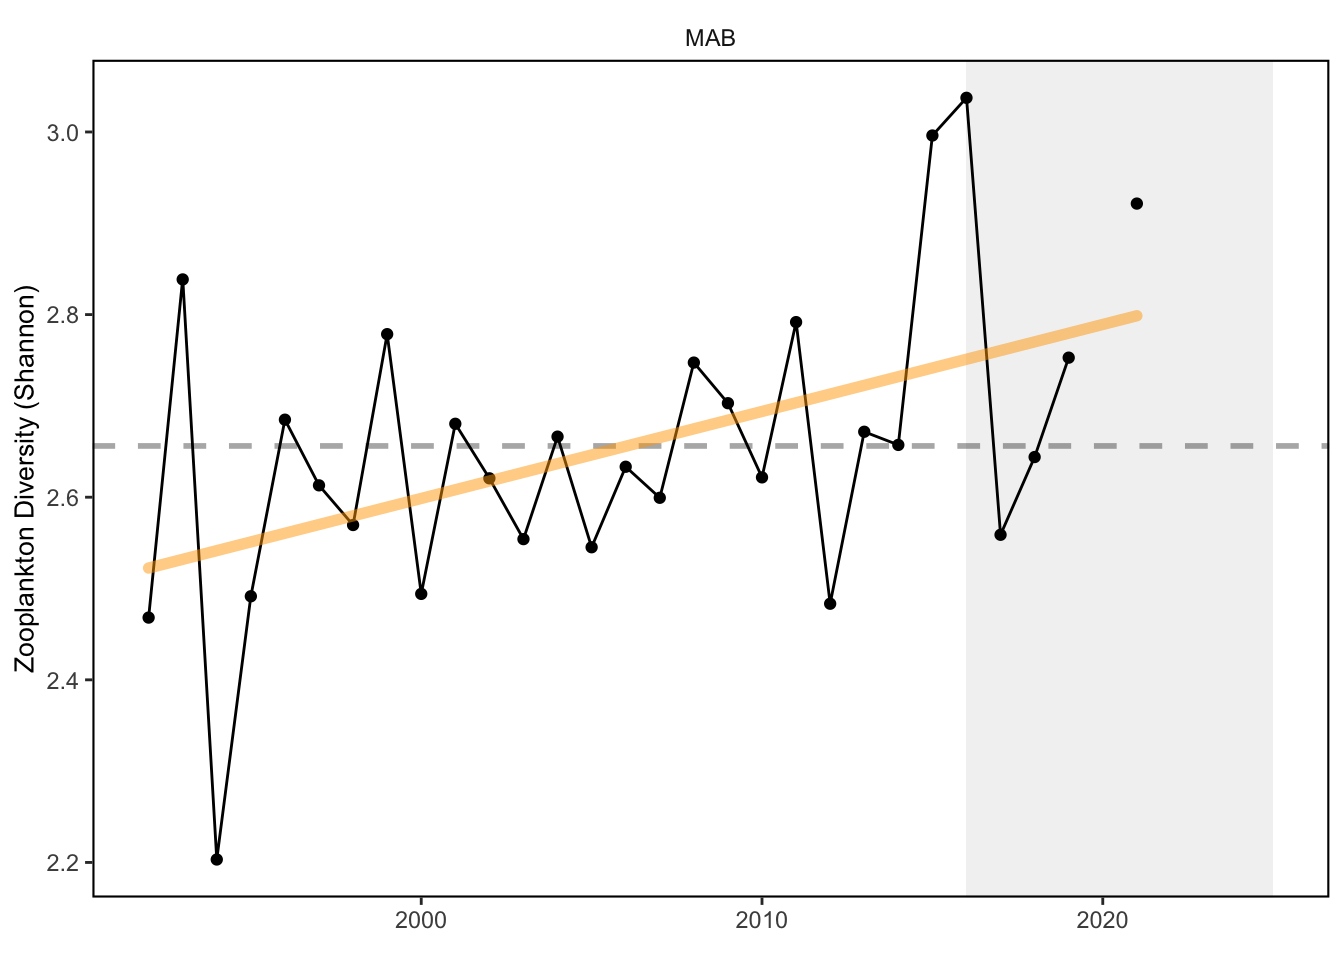
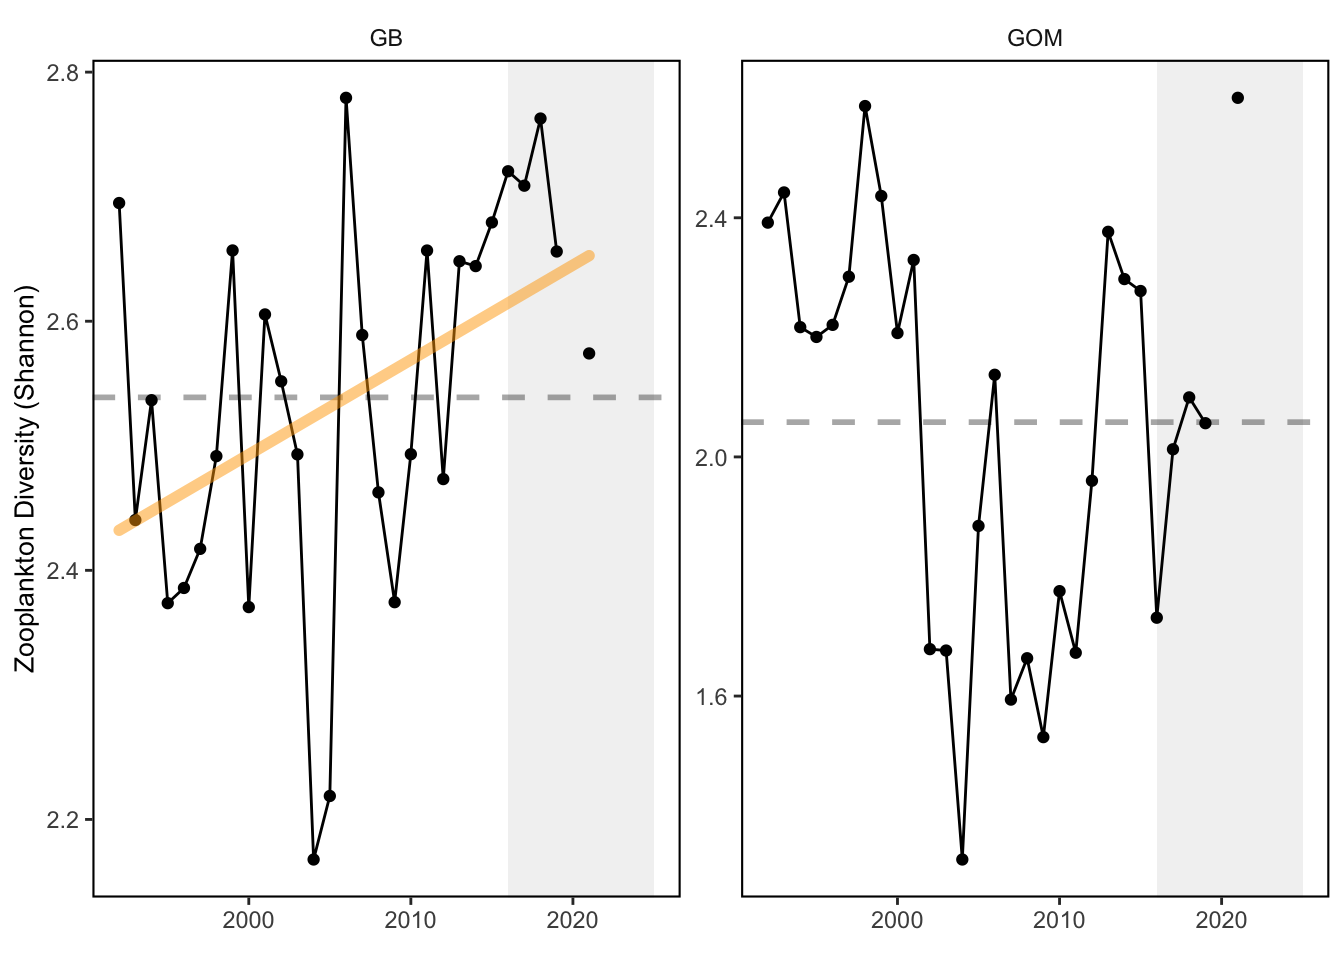
Zooplankton diversity is increasing in the Mid-Atlantic and on Georges Bank, but shows no trend in the Gulf of Maine. There is no vessel correction for this metric, so indices collected aboard the research vessel Albatross IV (up to 2008) and the research vessel Henry B. Bigelow (2009 - Present) are calculated separately.
2 SMART Attribute Section
2.1 Indicator documentation
2.1.1 Are indicators available for others to use (data downloadable)?
Yes
2.1.1.1 Where can indicators be found?
Data: https://noaa-edab.github.io/ecodata/index.html
Description: https://noaa-edab.github.io/catalog/zoo_diversity.html
Technical documentation: https://noaa-edab.github.io/tech-doc/zoo_diversity.html
2.1.1.2 How often are they updated? Are future updates likely?
[need sequential look at datasets for update frequency. Future requires judgement]
2.1.1.3 Who is the contact?
Ryan Morse, ryan.morse@noaa.gov; Harvey Walsh, harvey.walsh@noaa.gov; Kevin Friedland, kevin.friedland@noaa.gov
2.1.2 Gather indicator statistics
2.1.2.2 Length of time series, start and end date, periodicity
General overview: Annual
Indicator specifics:
Indicator | EPU | StartYear | EndYear | NumYears | MissingYears |
|---|---|---|---|---|---|
Zoo_Shannon-Wiener_Diversity_index | GB | 1977 | 2021 | 44 | 1 |
Zoo_Shannon-Wiener_Diversity_index | GOM | 1977 | 2021 | 44 | 1 |
Zoo_Shannon-Wiener_Diversity_index | MAB | 1977 | 2021 | 44 | 1 |
2.1.2.3 Spatial location, scale and extent
General overview: by EPU
Indicator specifics:
Indicator | EPU |
|---|---|
Zoo_Shannon-Wiener_Diversity_index | GB |
Zoo_Shannon-Wiener_Diversity_index | GOM |
Zoo_Shannon-Wiener_Diversity_index | MAB |
2.2 Indicator analysis/testing or history of use
2.2.1 What decision or advice processes are the indicators currently used in?
Zooplankton represent a critical trophic link from primary producers to fish in marine ecosystems. Trends in zooplankton community diversity may indicate changes in trophic stability over time.
2.2.2 What implications of the indicators are currently listed?
Zooplankton community diversity varies with changes in dominance of taxa. Increasing zooplankton diversity in the Mid-Atlantic is due to increases in abundance of several taxa and stable or declining dominance of an important copepod species. This suggests a shift in the zooplankton community that warrants continued monitoring to determine if managed species are affected. While still showing an overall increasing trend, the GB zooplankton community declined in diversity in 2021 due to the increase in abundance of the copepod Centropages typicus and salps. The GOM zooplankton community is usually dominated by Calanus finmarchicus, however their abundance decreased in 2021. This decrease plus an increase in abundance of other copepods (C. typicus, Metridia lucens, Oithona spp.), siphonophores, and pteropods resulted in high zooplankton diversity index in 2021.
2.2.4 Have the indicators been tested to ensure they respond proportionally to a change in the underlying process?
No
3 SMART rating
Category | Indicator | Element | Attribute | Rating | ElementRating | OverallRating |
|---|---|---|---|---|---|---|
Food-Web-Base | Zooplankton Diversity | Specific | Described | 1.0 | 0.6666667 | 0.5166667 |
Food-Web-Base | Zooplankton Diversity | Specific | Units | 1.0 | 0.6666667 | 0.5166667 |
Food-Web-Base | Zooplankton Diversity | Specific | Spatial | 1.0 | 0.6666667 | 0.5166667 |
Food-Web-Base | Zooplankton Diversity | Specific | Uncertainty | 0.0 | 0.6666667 | 0.5166667 |
Food-Web-Base | Zooplankton Diversity | Specific | Methods | 1.0 | 0.6666667 | 0.5166667 |
Food-Web-Base | Zooplankton Diversity | Specific | Code | 0.0 | 0.6666667 | 0.5166667 |
Food-Web-Base | Zooplankton Diversity | Measurable | Available | 1.0 | 0.5000000 | 0.5166667 |
Food-Web-Base | Zooplankton Diversity | Measurable | Online | 1.0 | 0.5000000 | 0.5166667 |
Food-Web-Base | Zooplankton Diversity | Measurable | Contact | 1.0 | 0.5000000 | 0.5166667 |
Food-Web-Base | Zooplankton Diversity | Measurable | SourceDat | 0.0 | 0.5000000 | 0.5166667 |
Food-Web-Base | Zooplankton Diversity | Measurable | SourceAvail | 0.0 | 0.5000000 | 0.5166667 |
Food-Web-Base | Zooplankton Diversity | Measurable | SourceContact | 0.0 | 0.5000000 | 0.5166667 |
Food-Web-Base | Zooplankton Diversity | Achievable | Tested | 0.0 | 0.0000000 | 0.5166667 |
Food-Web-Base | Zooplankton Diversity | Achievable | Sensitivity | 0.0 | 0.0000000 | 0.5166667 |
Food-Web-Base | Zooplankton Diversity | Achievable | TimeLag | 0.0 | 0.0000000 | 0.5166667 |
Food-Web-Base | Zooplankton Diversity | Relevant | Advice | 1.0 | 0.6666667 | 0.5166667 |
Food-Web-Base | Zooplankton Diversity | Relevant | Implications | 1.0 | 0.6666667 | 0.5166667 |
Food-Web-Base | Zooplankton Diversity | Relevant | TargThresh | 0.0 | 0.6666667 | 0.5166667 |
Food-Web-Base | Zooplankton Diversity | Timebound | Frequency | 1.0 | 0.7500000 | 0.5166667 |
Food-Web-Base | Zooplankton Diversity | Timebound | Updated | 0.5 | 0.7500000 | 0.5166667 |
3.1 Comments
[Fill below by hand once above data complete]
3.1.1 Additional potential links to management in addition to uses listed above
3.1.2 What additional work would be needed for the Council to use the indicator?
3.1.3 What issues are caused if there is a gap or delay in data underlying the indicator