SMART Indicator Report: Zooplankton Abundance Anomalies
1 Descriptive Section
1.2 Indicator name
Zooplankton Abundance Anomalies
Includes variable(s): Calfin, Chaetognatha, Cirripedia, Cnidaria, Cyclopoida, Decapoda, Diplostraca, Echinodermata, Euphausiacea, Gammaridea, Hyperiidea, LgCopepods, Mollusca, Mysidacea, Ostracoda, Polychaeta, Protozoa, Pteropod, SmCopepods, Tunicate
2 SMART Attribute Section
2.1 Indicator documentation
2.1.1 Are indicators available for others to use (data downloadable)?
Yes
2.1.1.1 Where can indicators be found?
Data: https://noaa-edab.github.io/ecodata/index.html
Description: https://noaa-edab.github.io/catalog/zoo_abundance_anom.html
Technical documentation: https://noaa-edab.github.io/tech-doc/zoo_abundance_anom.html
2.1.1.2 How often are they updated? Are future updates likely?
[need sequential look at datasets for update frequency. Future requires judgement]
2.1.1.3 Who is the contact?
Ryan Morse, ryan.morse@noaa.gov; Harvey Walsh, harvey.walsh@noaa.gov; Kevin Friedland, kevin.friedland@noaa.gov
2.1.2 Gather indicator statistics
2.1.2.1 Units
Indicator | Units |
|---|---|
Calfin | Unitless |
Chaetognatha | Unitless |
Cirripedia | Unitless |
Cnidaria | Unitless |
Cyclopoida | Unitless |
Decapoda | Unitless |
Diplostraca | Unitless |
Echinodermata | Unitless |
Euphausiacea | Unitless |
Gammaridea | Unitless |
Hyperiidea | Unitless |
LgCopepods | Unitless |
Mollusca | Unitless |
Mysidacea | Unitless |
Ostracoda | Unitless |
Polychaeta | Unitless |
Protozoa | Unitless |
Pteropod | Unitless |
SmCopepods | Unitless |
Tunicate | Unitless |
2.1.2.2 Length of time series, start and end date, periodicity
General overview: Annual
Indicator specifics:
Indicator | EPU | StartYear | EndYear | NumYears | MissingYears |
|---|---|---|---|---|---|
Calfin | GB | 1977 | 2021 | 45 | 0 |
Calfin | GOM | 1977 | 2021 | 45 | 0 |
Calfin | MAB | 1977 | 2021 | 45 | 0 |
Chaetognatha | GB | 1977 | 2021 | 45 | 0 |
Chaetognatha | GOM | 1977 | 2021 | 45 | 0 |
Chaetognatha | MAB | 1977 | 2021 | 45 | 0 |
Cirripedia | GB | 1977 | 2021 | 45 | 0 |
Cirripedia | GOM | 1977 | 2021 | 45 | 0 |
Cirripedia | MAB | 1977 | 2021 | 45 | 0 |
Cnidaria | GB | 1977 | 2021 | 45 | 0 |
Cnidaria | GOM | 1977 | 2021 | 45 | 0 |
Cnidaria | MAB | 1977 | 2021 | 45 | 0 |
Cyclopoida | GB | 1977 | 2021 | 45 | 0 |
Cyclopoida | GOM | 1977 | 2021 | 45 | 0 |
Cyclopoida | MAB | 1977 | 2021 | 45 | 0 |
Decapoda | GB | 1977 | 2021 | 45 | 0 |
Decapoda | GOM | 1977 | 2021 | 45 | 0 |
Decapoda | MAB | 1977 | 2021 | 45 | 0 |
Diplostraca | GB | 1977 | 2021 | 45 | 0 |
Diplostraca | GOM | 1977 | 2021 | 45 | 0 |
Diplostraca | MAB | 1977 | 2021 | 45 | 0 |
Echinodermata | GB | 1977 | 2021 | 45 | 0 |
Echinodermata | GOM | 1977 | 2021 | 45 | 0 |
Echinodermata | MAB | 1977 | 2021 | 45 | 0 |
Euphausiacea | GB | 1977 | 2021 | 45 | 0 |
Euphausiacea | GOM | 1977 | 2021 | 45 | 0 |
Euphausiacea | MAB | 1977 | 2021 | 45 | 0 |
Gammaridea | GB | 1977 | 2021 | 45 | 0 |
Gammaridea | GOM | 1977 | 2021 | 45 | 0 |
Gammaridea | MAB | 1977 | 2021 | 45 | 0 |
Hyperiidea | GB | 1977 | 2021 | 45 | 0 |
Hyperiidea | GOM | 1977 | 2021 | 45 | 0 |
Hyperiidea | MAB | 1977 | 2021 | 45 | 0 |
LgCopepods | GB | 1977 | 2021 | 45 | 0 |
LgCopepods | GOM | 1977 | 2021 | 45 | 0 |
LgCopepods | MAB | 1977 | 2021 | 45 | 0 |
Mollusca | GB | 1977 | 2021 | 45 | 0 |
Mollusca | GOM | 1977 | 2021 | 45 | 0 |
Mollusca | MAB | 1977 | 2021 | 45 | 0 |
Mysidacea | GB | 1977 | 2021 | 45 | 0 |
Mysidacea | GOM | 1977 | 2021 | 45 | 0 |
Mysidacea | MAB | 1977 | 2021 | 45 | 0 |
Ostracoda | GB | 1977 | 2021 | 45 | 0 |
Ostracoda | GOM | 1977 | 2021 | 45 | 0 |
Ostracoda | MAB | 1977 | 2021 | 45 | 0 |
Polychaeta | GB | 1977 | 2021 | 45 | 0 |
Polychaeta | GOM | 1977 | 2021 | 45 | 0 |
Polychaeta | MAB | 1977 | 2021 | 45 | 0 |
Protozoa | GB | 1977 | 2021 | 45 | 0 |
Protozoa | GOM | 1977 | 2021 | 45 | 0 |
Protozoa | MAB | 1977 | 2021 | 45 | 0 |
Pteropod | GB | 1977 | 2021 | 45 | 0 |
Pteropod | GOM | 1977 | 2021 | 45 | 0 |
Pteropod | MAB | 1977 | 2021 | 45 | 0 |
SmCopepods | GB | 1977 | 2021 | 45 | 0 |
SmCopepods | GOM | 1977 | 2021 | 45 | 0 |
SmCopepods | MAB | 1977 | 2021 | 45 | 0 |
Tunicate | GB | 1977 | 2021 | 45 | 0 |
Tunicate | GOM | 1977 | 2021 | 45 | 0 |
Tunicate | MAB | 1977 | 2021 | 45 | 0 |
2.1.2.3 Spatial location, scale and extent
General overview: by EPU
Indicator specifics:
Indicator | EPU |
|---|---|
Calfin | GB |
Calfin | GOM |
Calfin | MAB |
Chaetognatha | GB |
Chaetognatha | GOM |
Chaetognatha | MAB |
Cirripedia | GB |
Cirripedia | GOM |
Cirripedia | MAB |
Cnidaria | GB |
Cnidaria | GOM |
Cnidaria | MAB |
Cyclopoida | GB |
Cyclopoida | GOM |
Cyclopoida | MAB |
Decapoda | GB |
Decapoda | GOM |
Decapoda | MAB |
Diplostraca | GB |
Diplostraca | GOM |
Diplostraca | MAB |
Echinodermata | GB |
Echinodermata | GOM |
Echinodermata | MAB |
Euphausiacea | GB |
Euphausiacea | GOM |
Euphausiacea | MAB |
Gammaridea | GB |
Gammaridea | GOM |
Gammaridea | MAB |
Hyperiidea | GB |
Hyperiidea | GOM |
Hyperiidea | MAB |
LgCopepods | GB |
LgCopepods | GOM |
LgCopepods | MAB |
Mollusca | GB |
Mollusca | GOM |
Mollusca | MAB |
Mysidacea | GB |
Mysidacea | GOM |
Mysidacea | MAB |
Ostracoda | GB |
Ostracoda | GOM |
Ostracoda | MAB |
Polychaeta | GB |
Polychaeta | GOM |
Polychaeta | MAB |
Protozoa | GB |
Protozoa | GOM |
Protozoa | MAB |
Pteropod | GB |
Pteropod | GOM |
Pteropod | MAB |
SmCopepods | GB |
SmCopepods | GOM |
SmCopepods | MAB |
Tunicate | GB |
Tunicate | GOM |
Tunicate | MAB |
2.1.3 Are methods clearly documented to obtain source data and calculate indicators?
Yes
2.1.3.1 Can the indicator be calculated from current documentation?
Data are from the publicly available plankton dataset at NCEI Accession 0187513. The accession metadata has a list of excluded samples and cruises based on Kane (2007) and Kane (2011) in addition to other collection details.
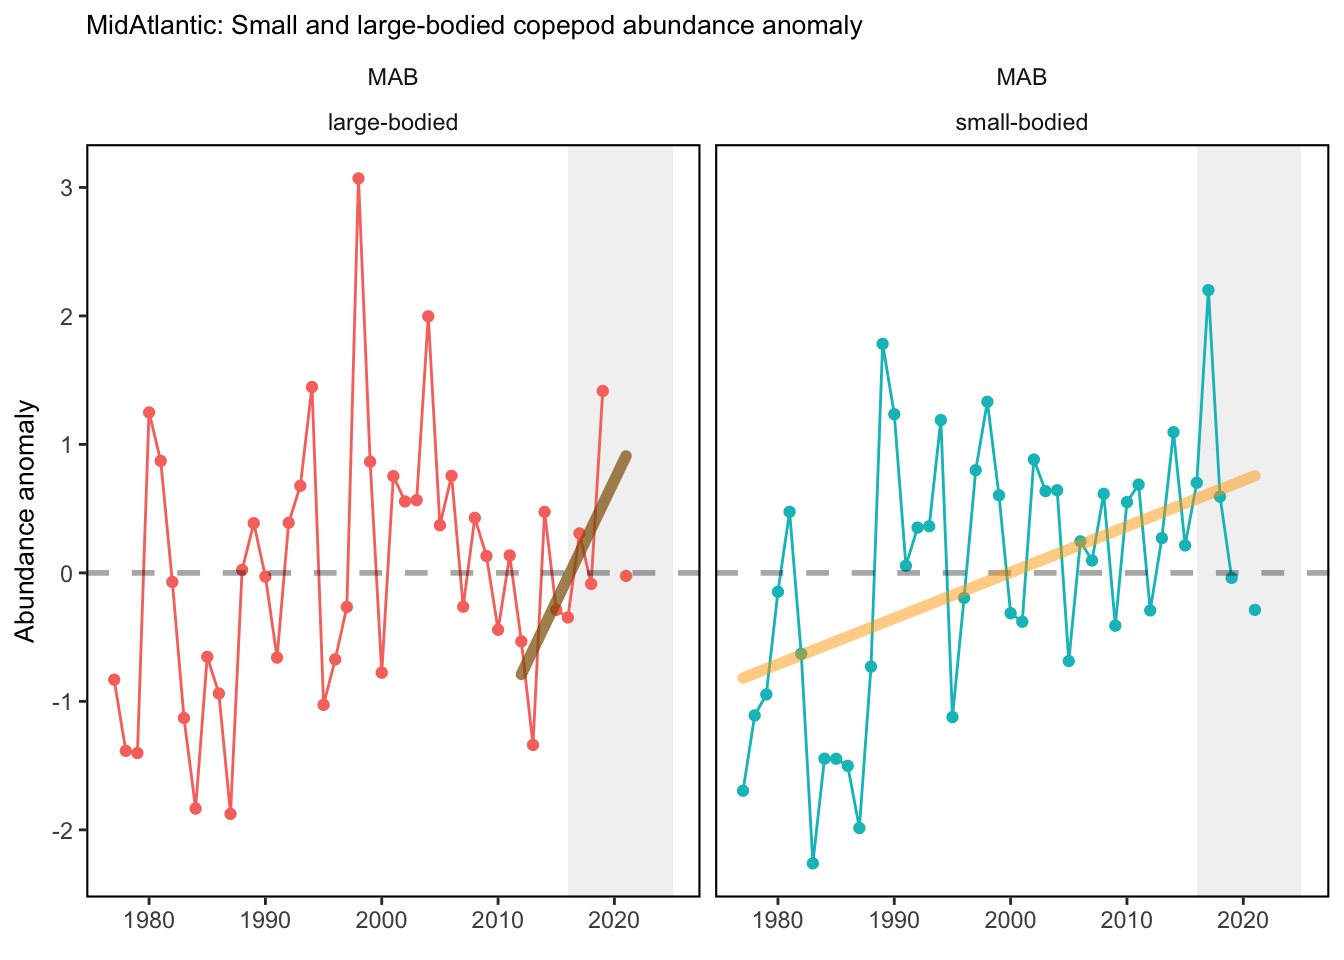
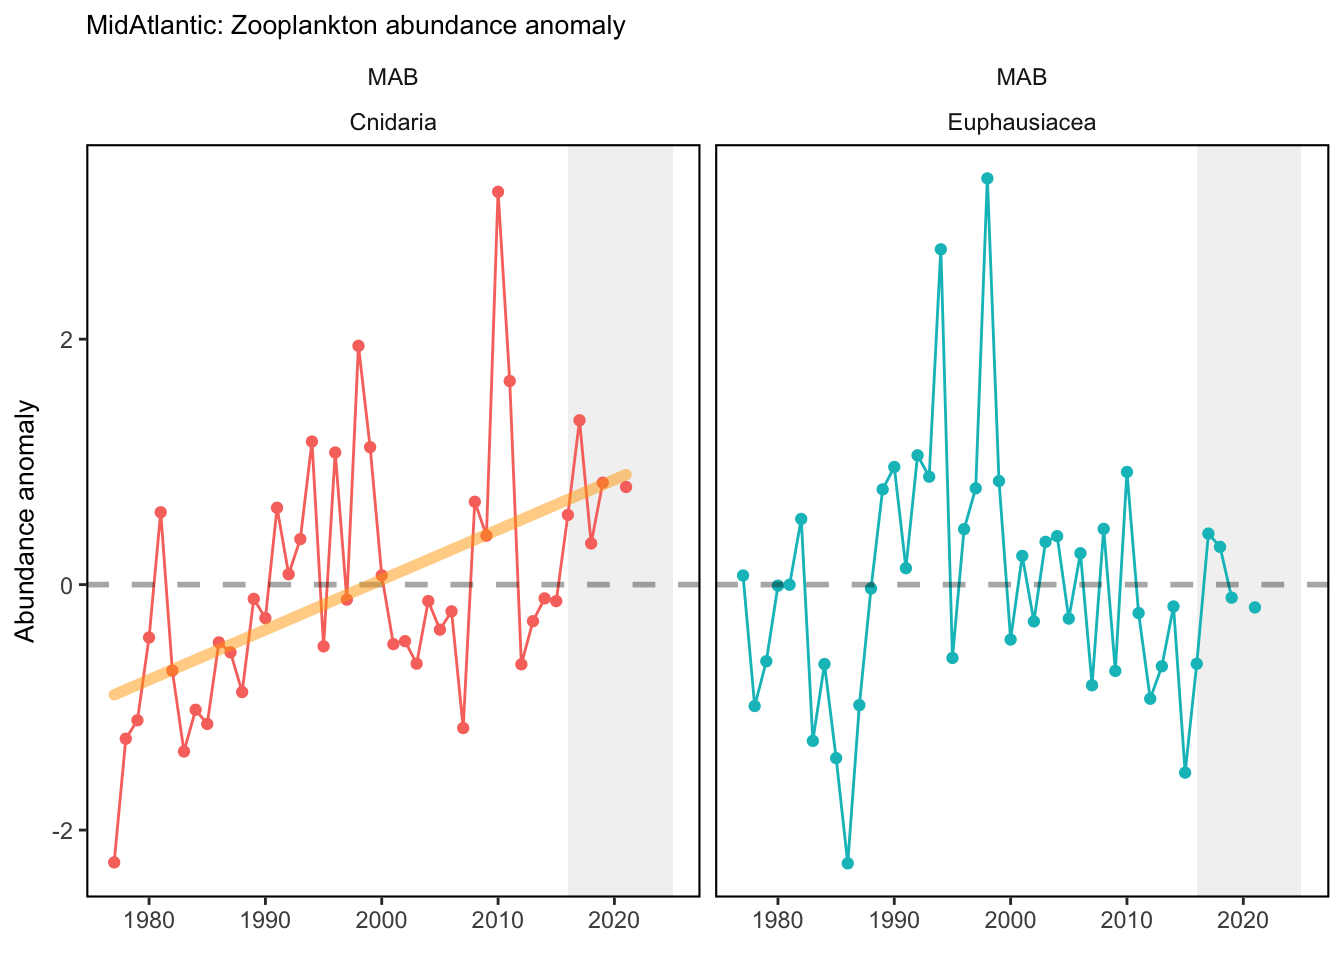
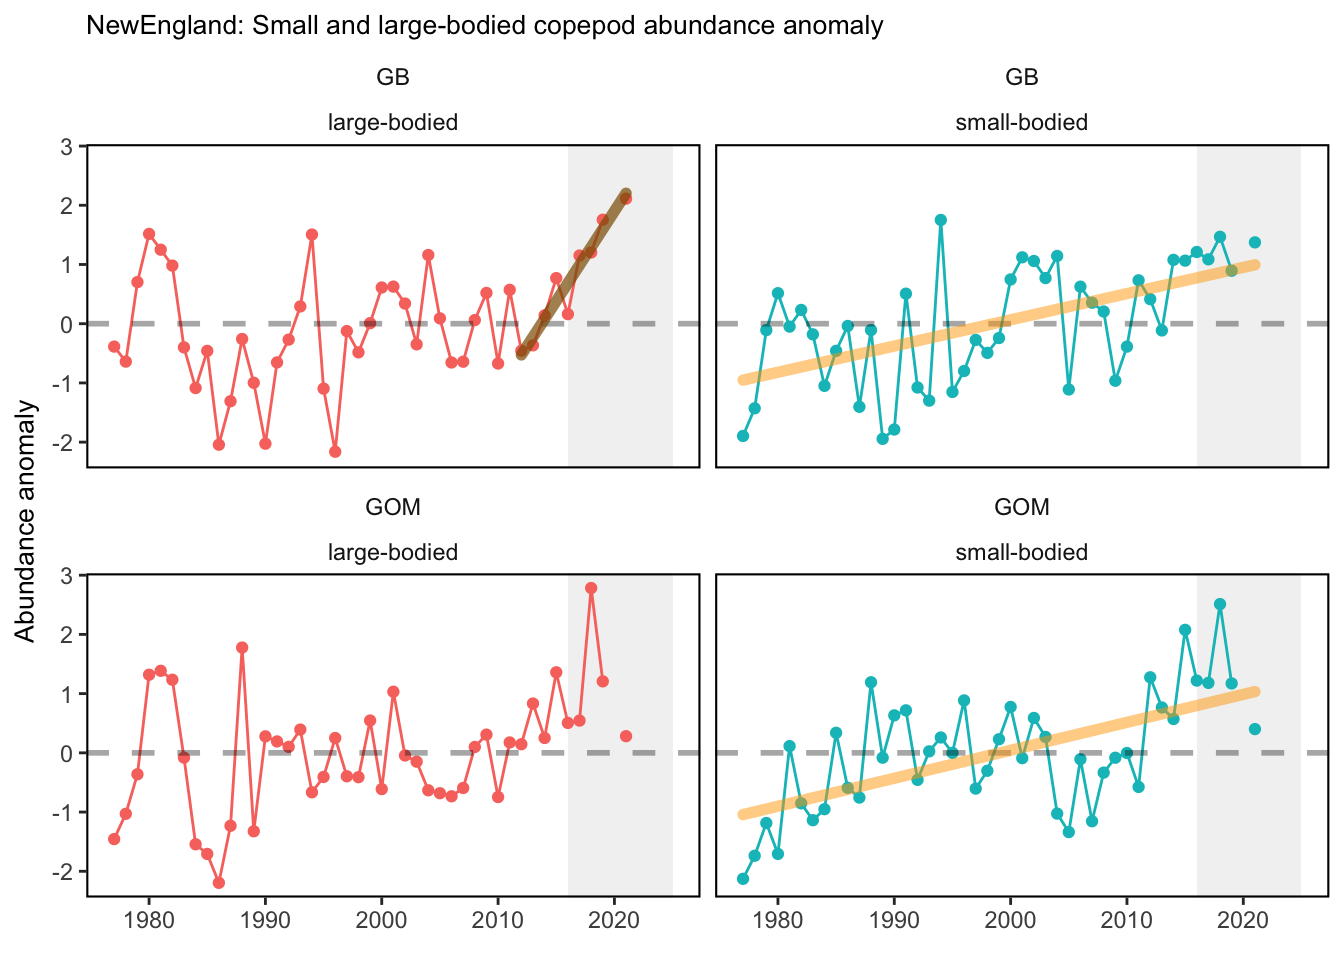
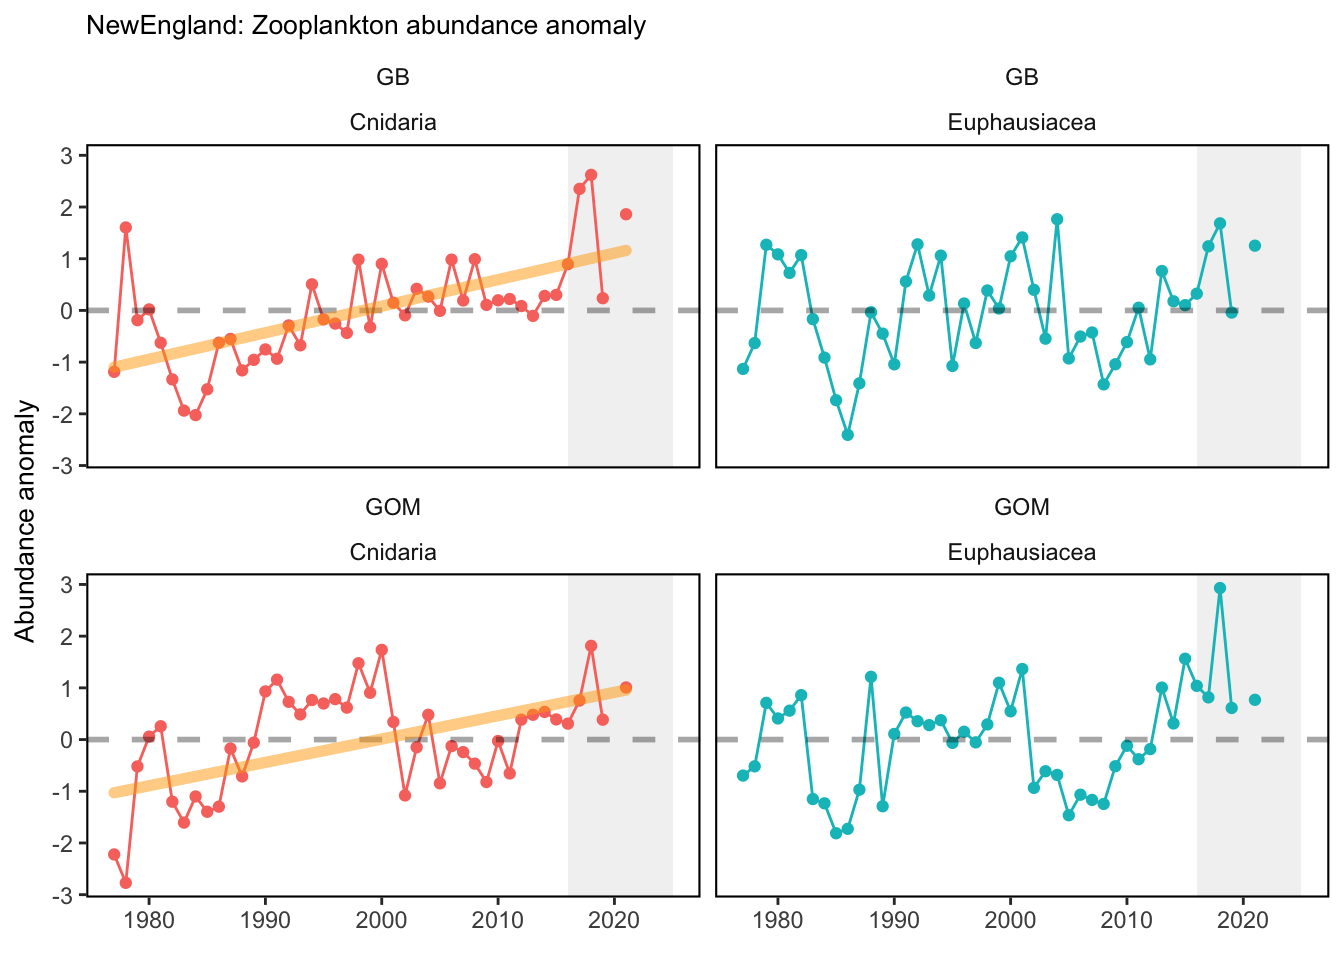
Data are processed similarly to Kane (2007) and C. Perretti et al. (2017), where a mean annual abundance by date is computed by area for each species meeting inclusion metrics set in Morse et al. (2017). This is accomplished by binning all samples for a given species to bi-monthly collection dates based on median cruise date and taking the mean, then fitting a spline interpolation between mean bi-monthly abundance to give expected abundance on any given day of the year. Code used for zooplankton data analysis can be found here. Abundance anomalies are computed from the expected abundance on the day of sample collection. Abundance anomaly time series are constructed for Centropages typicus, Pseudocalanus spp., Calanus finmarchicus, and total zooplankton biovolume. The small-large copepod size index is computed by averaging the individual abundance anomalies of Pseudocalanus spp., Centropages hamatus, Centropages typicus, and Temora longicornis, and subtracting the abundance anomaly of Calanus finmarchicus. This index tracks the overall dominance of the small bodied copepods relative to the largest copepod in the Northeast U.S. region, Calanus finmarchicus. Stratified abundance of euphausiids and cnidarians were included in the 2020 State of the Ecosystem reports. These were calculated as the log of estimated absolute number of individuals. Time series of zooplankton abundance in the spring and fall months have been presented in the 2019 Mid-Atlantic State of the Ecosystem report. Raw abundance data were sourced from the EcoMon cruises referenced above, and ordinary kriging was used to estimate seasonal abundance over the Northeast Shelf. These data were then aggregated further into time series of mean abundance by Ecological Production Unit. Time series of zooplankton diversity (effective shannon) was calculated using 42 zooplankton classifications collected fromt the EcoMon cruises, referenced above.
2.1.4 Are indicator underlying source data linked or easy to find?
Source data through 2019 are publicly available here, and data through 2021 are available upon request from harvey.walsh@noaa.gov. Derived data can be found here.
2.1.4.1 Where are source data stored?
Zooplankton data are from the National Oceanographic and Atmospheric Administration Marine Resources Monitoring, Assessment and Prediction (MARMAP) program and Ecosystem Monitoring (EcoMon) cruises detailed extensively in Kane (2007), Kane (2011), and Morse et al. (2017).
2.1.4.2 How/by whom are source data updated? Are future updates likely?
Harvey Walsh, harvey.walsh@noaa.gov
[likelihood of source data updates requires judgement, enter by hand]
2.2 Indicator analysis/testing or history of use
2.2.1 What decision or advice processes are the indicators currently used in?
Zooplankton represent a critical trophic link from primary producers to fish in marine ecosystems.
2.2.2 What implications of the indicators are currently listed?
Check these. If they are correct, we could be seeing the less energy dense zooplankton becoming more abundant in each system.
2.2.4 Have the indicators been tested to ensure they respond proportionally to a change in the underlying process?
No
3 SMART rating
Category | Indicator | Element | Attribute | Rating | ElementRating | OverallRating |
|---|---|---|---|---|---|---|
Food-Web-Base | Zooplankton Abundance Anomalies | Specific | Described | 1.0 | 0.6666667 | 0.6166667 |
Food-Web-Base | Zooplankton Abundance Anomalies | Specific | Units | 1.0 | 0.6666667 | 0.6166667 |
Food-Web-Base | Zooplankton Abundance Anomalies | Specific | Spatial | 1.0 | 0.6666667 | 0.6166667 |
Food-Web-Base | Zooplankton Abundance Anomalies | Specific | Uncertainty | 0.0 | 0.6666667 | 0.6166667 |
Food-Web-Base | Zooplankton Abundance Anomalies | Specific | Methods | 1.0 | 0.6666667 | 0.6166667 |
Food-Web-Base | Zooplankton Abundance Anomalies | Specific | Code | 0.0 | 0.6666667 | 0.6166667 |
Food-Web-Base | Zooplankton Abundance Anomalies | Measurable | Available | 1.0 | 1.0000000 | 0.6166667 |
Food-Web-Base | Zooplankton Abundance Anomalies | Measurable | Online | 1.0 | 1.0000000 | 0.6166667 |
Food-Web-Base | Zooplankton Abundance Anomalies | Measurable | Contact | 1.0 | 1.0000000 | 0.6166667 |
Food-Web-Base | Zooplankton Abundance Anomalies | Measurable | SourceDat | 1.0 | 1.0000000 | 0.6166667 |
Food-Web-Base | Zooplankton Abundance Anomalies | Measurable | SourceAvail | 1.0 | 1.0000000 | 0.6166667 |
Food-Web-Base | Zooplankton Abundance Anomalies | Measurable | SourceContact | 1.0 | 1.0000000 | 0.6166667 |
Food-Web-Base | Zooplankton Abundance Anomalies | Achievable | Tested | 0.0 | 0.0000000 | 0.6166667 |
Food-Web-Base | Zooplankton Abundance Anomalies | Achievable | Sensitivity | 0.0 | 0.0000000 | 0.6166667 |
Food-Web-Base | Zooplankton Abundance Anomalies | Achievable | TimeLag | 0.0 | 0.0000000 | 0.6166667 |
Food-Web-Base | Zooplankton Abundance Anomalies | Relevant | Advice | 1.0 | 0.6666667 | 0.6166667 |
Food-Web-Base | Zooplankton Abundance Anomalies | Relevant | Implications | 1.0 | 0.6666667 | 0.6166667 |
Food-Web-Base | Zooplankton Abundance Anomalies | Relevant | TargThresh | 0.0 | 0.6666667 | 0.6166667 |
Food-Web-Base | Zooplankton Abundance Anomalies | Timebound | Frequency | 1.0 | 0.7500000 | 0.6166667 |
Food-Web-Base | Zooplankton Abundance Anomalies | Timebound | Updated | 0.5 | 0.7500000 | 0.6166667 |
3.1 Comments
[Fill below by hand once above data complete]
3.1.1 Additional potential links to management in addition to uses listed above
3.1.2 What additional work would be needed for the Council to use the indicator?
3.1.3 What issues are caused if there is a gap or delay in data underlying the indicator