SMART Indicator Report: Warm Core Rings
1 Descriptive Section
1.3 Indicator brief description
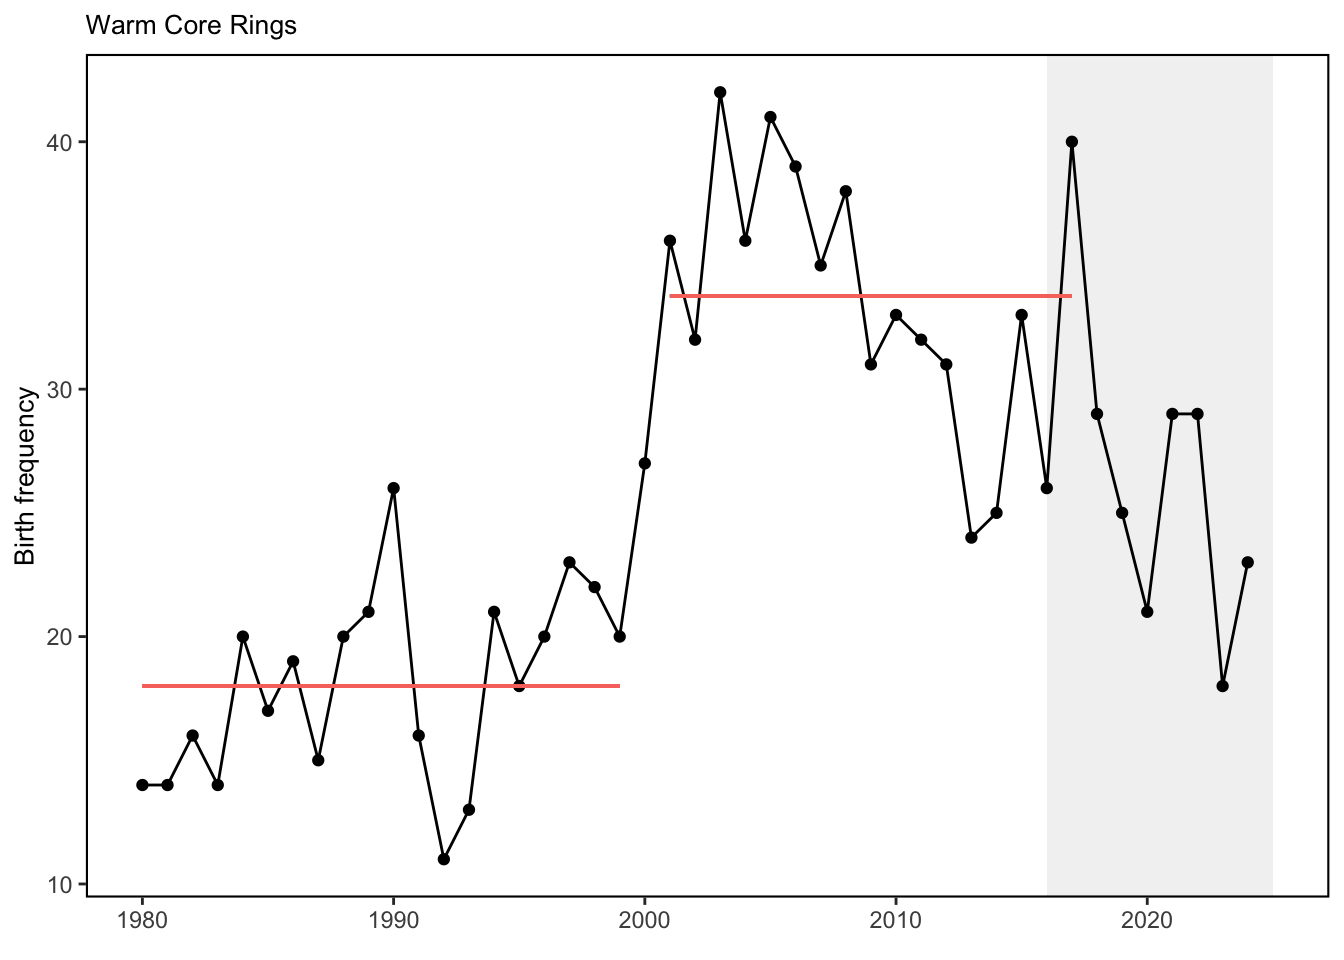
Number of warm core rings produced annually by the Gulf Stream off the Northeast US
1.4 Indicator visualization
Prior to 2000, an average of 18 warm core rings were formed by the Gulf Stream off the Northeast US shelf. From 2000-2017, an average of 33 warm core rings were formed. Annual numbers of warm core rings have been updated using the same methods for each year since 2017, but the regime shift analysis has not been updated.
2 SMART Attribute Section
2.1 Indicator documentation
2.1.1 Are indicators available for others to use (data downloadable)?
Yes
2.1.1.1 Where can indicators be found?
Data: https://noaa-edab.github.io/ecodata/index.html
Description: https://noaa-edab.github.io/catalog/wcr.html
Technical documentation: https://noaa-edab.github.io/tech-doc/wcr.html
2.1.1.2 How often are they updated? Are future updates likely?
[need sequential look at datasets for update frequency. Future requires judgement]
2.1.1.3 Who is the contact?
Avijit Gangopadhyay avijit.gangopadhyay@umassd.edu
2.1.2 Gather indicator statistics
2.1.2.2 Length of time series, start and end date, periodicity
General overview: Annual
Indicator specifics:
Indicator | EPU | StartYear | EndYear | NumYears | MissingYears |
|---|---|---|---|---|---|
Warm Core Rings | All | 1980 | 2024 | 45 | 0 |
2.1.2.3 Spatial location, scale and extent
General overview: Full shelf
Indicator specifics:
Indicator | EPU |
|---|---|
Warm Core Rings | All |
2.1.3 Are methods clearly documented to obtain source data and calculate indicators?
Yes
2.1.3.1 Can the indicator be calculated from current documentation?
The data from Gangopadhyay et al. (2019) were provided by Avijit Gangopandhyay, School for Marine Science and Technology, University of Massachusetts Dartmouth, MA.
A sequential regime shift detection algorithm was used to identify the regimes evident in the warm core ring formation time-series. See Gangopadhyay et al. (2019) for details.
2.1.4 Are indicator underlying source data linked or easy to find?
Data is available upon request.
2.1.4.1 Where are source data stored?
Gulf Stream charts from Jennifer Clark are the primary data source for the warm core ring analysis in Gangopadhyay et al. (2019). The Gulf Stream charts use infra-red (IR) imagery, satellite altimetry data, and surface in-situ temperature data in 3-day composite images are regularly produced by NOAA and/or the Johns Hopkins University Applied Physics Lab (fermi) group (see http://fermi.jhuapl.edu for more details).
2.2 Indicator analysis/testing or history of use
2.2.1 What decision or advice processes are the indicators currently used in?
Warm core rings are eddies formed from Gulf Stream meanders that transport warm Gulf Stream water into the cooler waters of the slope sea just off the Northeast US continental shelf. These rings transport both warm water and associated plankton and fish from the Gulf Stream towards the shelf and may form important habitat for oceanic fishery species, such as Illex squid. The indicator presented here extends published work [91]; with updated counts of warm core rings.
2.2.2 What implications of the indicators are currently listed?
The increased instability of the Gulf Stream position and warming of the Slope Sea may be connected to the regime shift increase in the number of warm core rings formed annually in the Northwest Atlantic [91,92]. When warm core rings and eddies interact with the continental slope they can transport warm, salty water to the continental shelf [93], which can alter the habitat and disrupt seasonal movements of fish [94]. Transport of offshore water onto the shelf is happening more frequently [94,95] and can contribute to marine heatwaves in the Mid-Atlantic Bight [93,96] as well as the movement of shelf-break species inshore [94,97,98].
2.2.4 Have the indicators been tested to ensure they respond proportionally to a change in the underlying process?
No
3 SMART rating
Category | Indicator | Element | Attribute | Rating | ElementRating | OverallRating |
|---|---|---|---|---|---|---|
Habitat-Physical | Warm Core Rings | Specific | Described | 1 | 0.6666667 | 0.7333333 |
Habitat-Physical | Warm Core Rings | Specific | Units | 1 | 0.6666667 | 0.7333333 |
Habitat-Physical | Warm Core Rings | Specific | Spatial | 1 | 0.6666667 | 0.7333333 |
Habitat-Physical | Warm Core Rings | Specific | Uncertainty | 0 | 0.6666667 | 0.7333333 |
Habitat-Physical | Warm Core Rings | Specific | Methods | 1 | 0.6666667 | 0.7333333 |
Habitat-Physical | Warm Core Rings | Specific | Code | 0 | 0.6666667 | 0.7333333 |
Habitat-Physical | Warm Core Rings | Measurable | Available | 1 | 1.0000000 | 0.7333333 |
Habitat-Physical | Warm Core Rings | Measurable | Online | 1 | 1.0000000 | 0.7333333 |
Habitat-Physical | Warm Core Rings | Measurable | Contact | 1 | 1.0000000 | 0.7333333 |
Habitat-Physical | Warm Core Rings | Measurable | SourceDat | 1 | 1.0000000 | 0.7333333 |
Habitat-Physical | Warm Core Rings | Measurable | SourceAvail | 1 | 1.0000000 | 0.7333333 |
Habitat-Physical | Warm Core Rings | Measurable | SourceContact | 1 | 1.0000000 | 0.7333333 |
Habitat-Physical | Warm Core Rings | Achievable | Tested | 0 | 0.3333333 | 0.7333333 |
Habitat-Physical | Warm Core Rings | Achievable | Sensitivity | 1 | 0.3333333 | 0.7333333 |
Habitat-Physical | Warm Core Rings | Achievable | TimeLag | 0 | 0.3333333 | 0.7333333 |
Habitat-Physical | Warm Core Rings | Relevant | Advice | 1 | 0.6666667 | 0.7333333 |
Habitat-Physical | Warm Core Rings | Relevant | Implications | 1 | 0.6666667 | 0.7333333 |
Habitat-Physical | Warm Core Rings | Relevant | TargThresh | 0 | 0.6666667 | 0.7333333 |
Habitat-Physical | Warm Core Rings | Timebound | Frequency | 1 | 1.0000000 | 0.7333333 |
Habitat-Physical | Warm Core Rings | Timebound | Updated | 1 | 1.0000000 | 0.7333333 |
3.1 Comments
[Fill below by hand once above data complete]
3.1.1 Additional potential links to management in addition to uses listed above
3.1.2 What additional work would be needed for the Council to use the indicator?
3.1.3 What issues are caused if there is a gap or delay in data underlying the indicator