SMART Indicator Report: Transition Dates
1 Descriptive Section
1.3 Indicator brief description
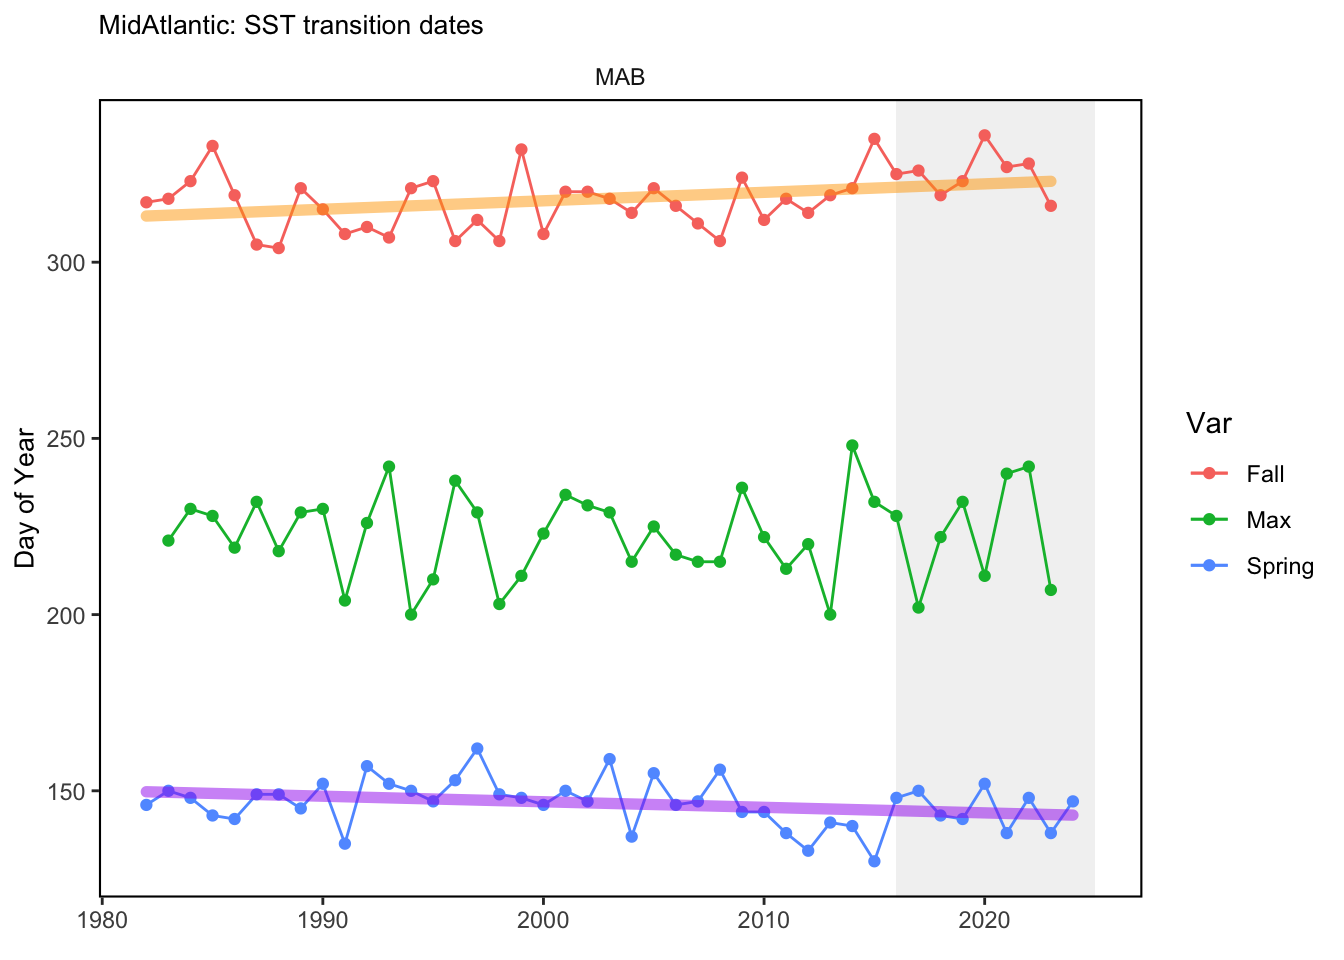
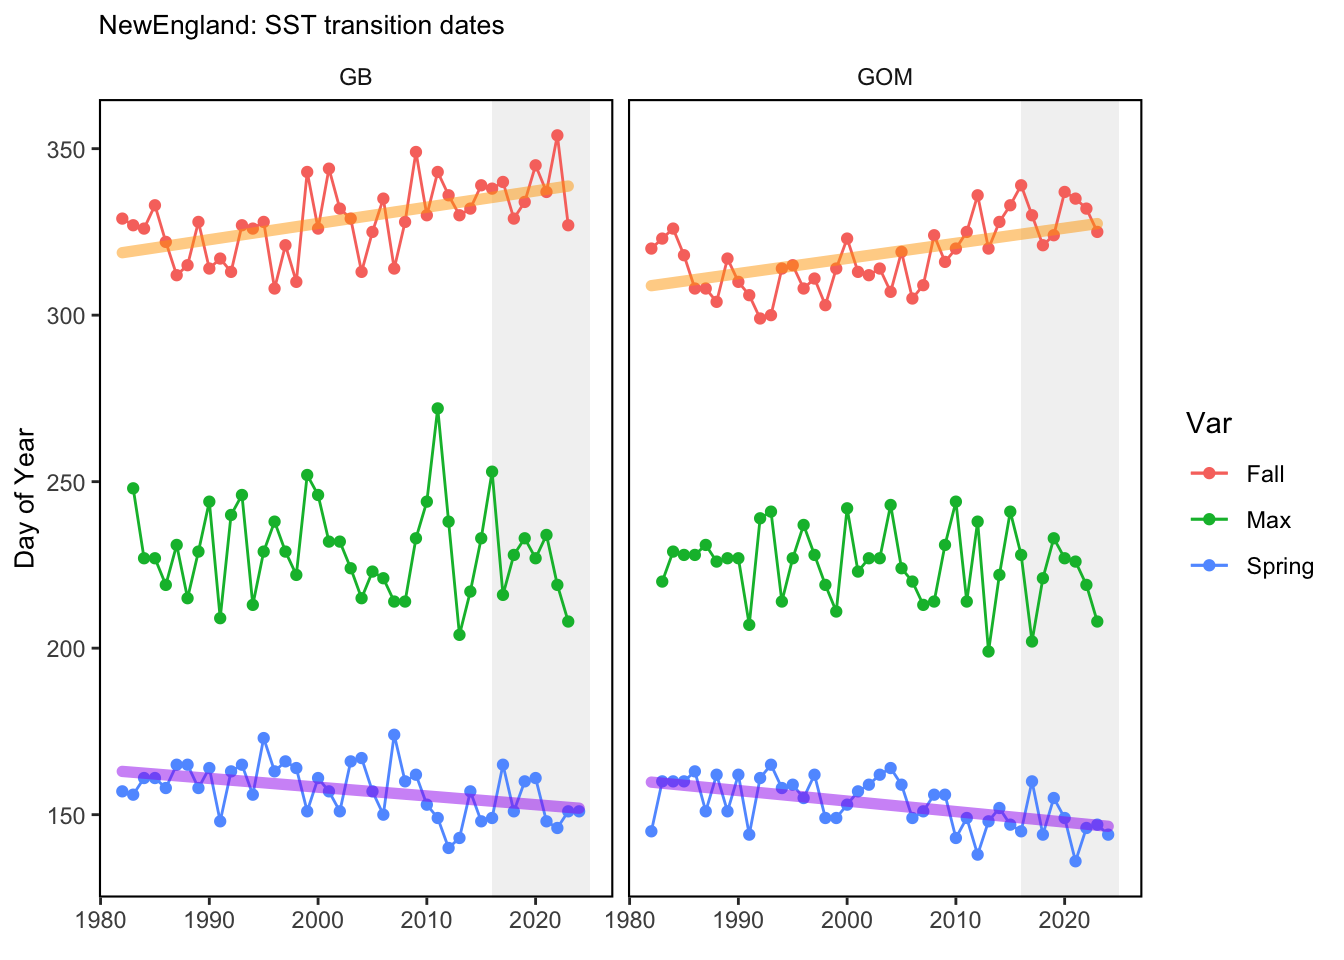
The date that cool winter conditions transition to warm stratified summer conditions.
1.4 Indicator visualization
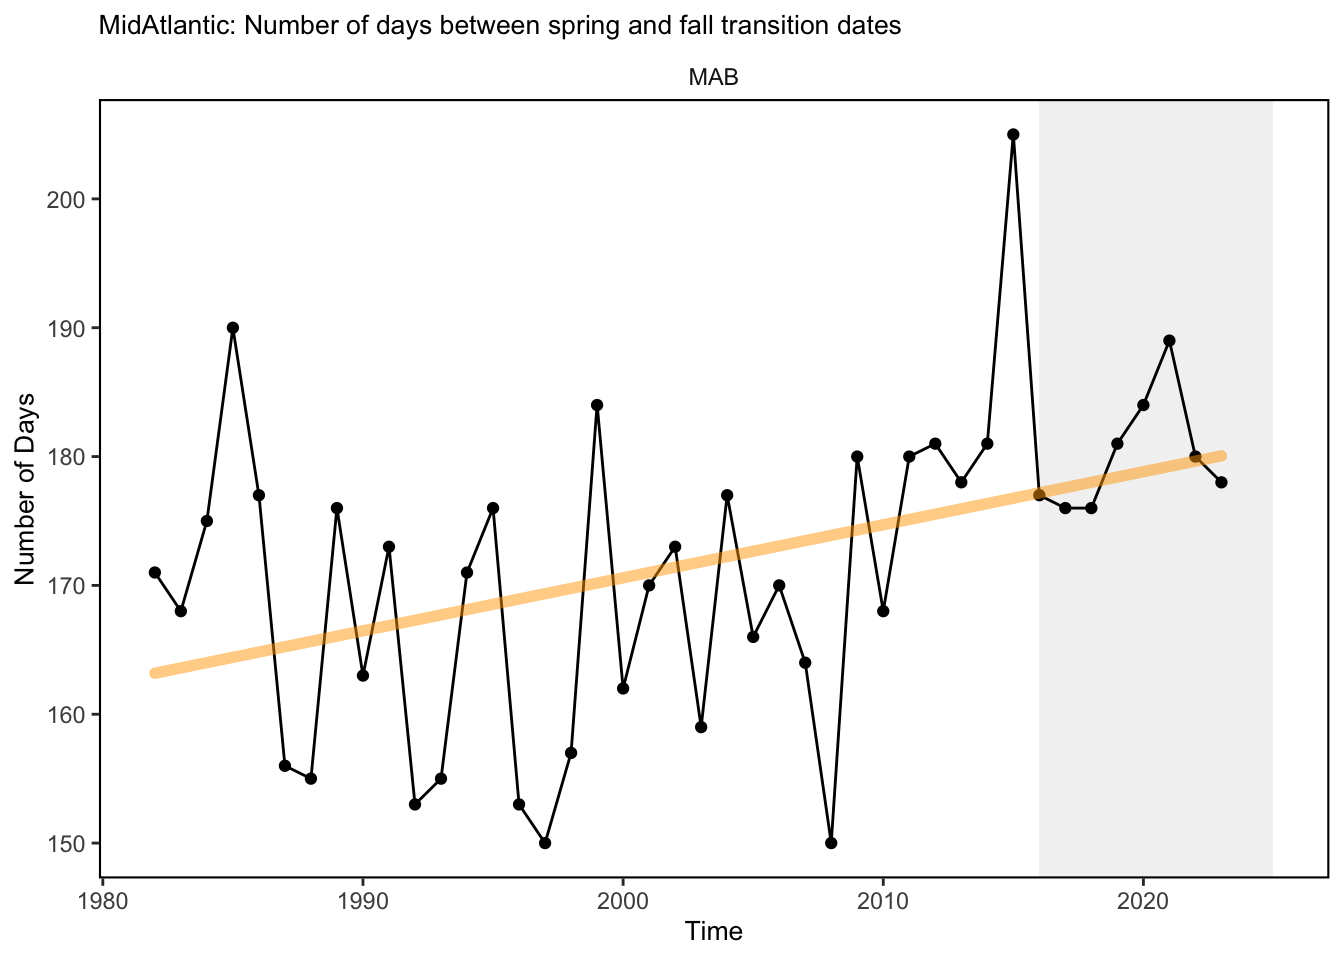
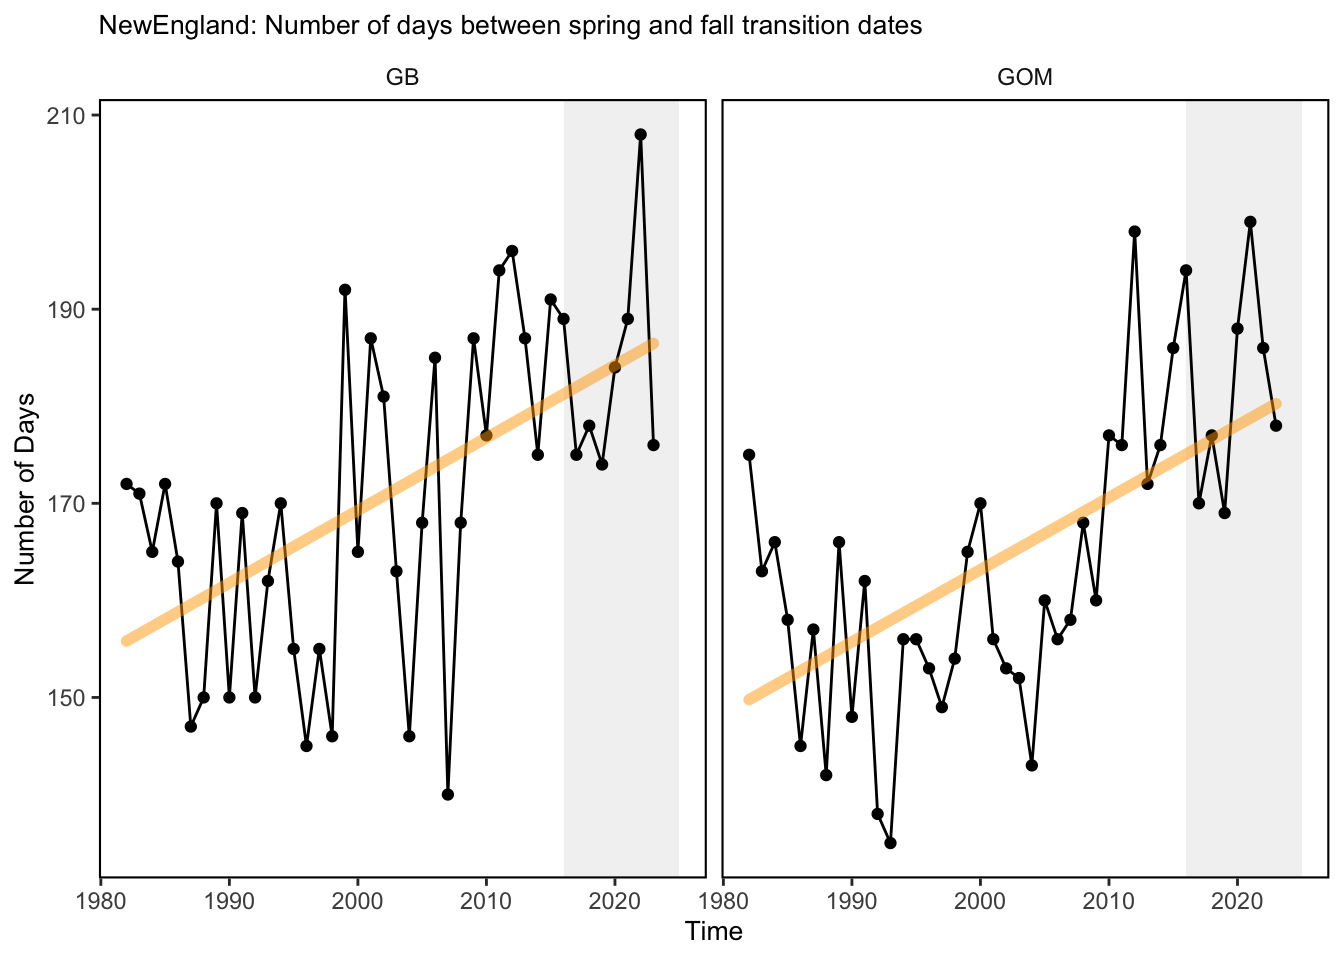
Ocean summer length in Mid-Atlantic: the annual total number of days between the spring thermal transition date and the fall thermal transition date. The transition dates are defined as the day of the year when surface temperatures changeover from cool to warm conditions in the spring and back to cool conditions in the fall.
2 SMART Attribute Section
2.1 Indicator documentation
2.1.1 Are indicators available for others to use (data downloadable)?
Yes
2.1.1.1 Where can indicators be found?
Data: https://noaa-edab.github.io/ecodata/index.html
Description: https://noaa-edab.github.io/catalog/trans_dates.html
Technical documentation: https://noaa-edab.github.io/tech-doc/trans_dates.html
2.1.1.2 How often are they updated? Are future updates likely?
[need sequential look at datasets for update frequency. Future requires judgement]
2.1.2 Gather indicator statistics
2.1.2.1 Units
Indicator | Units |
|---|---|
falltrans | no Units field |
maxday | no Units field |
sprtrans | no Units field |
sumlen | no Units field |
2.1.2.2 Length of time series, start and end date, periodicity
General overview: Annual time series (1982 to 2023)
Indicator specifics:
Indicator | EPU | StartYear | EndYear | NumYears | MissingYears |
|---|---|---|---|---|---|
falltrans | GB | 1982 | 2023 | 42 | 0 |
falltrans | GOM | 1982 | 2023 | 42 | 0 |
falltrans | MAB | 1982 | 2023 | 42 | 0 |
maxday | GB | 1983 | 2023 | 41 | 0 |
maxday | GOM | 1983 | 2023 | 41 | 0 |
maxday | MAB | 1983 | 2023 | 41 | 0 |
sprtrans | GB | 1982 | 2024 | 43 | 0 |
sprtrans | GOM | 1982 | 2024 | 43 | 0 |
sprtrans | MAB | 1982 | 2024 | 43 | 0 |
sumlen | GB | 1982 | 2023 | 42 | 0 |
sumlen | GOM | 1982 | 2023 | 42 | 0 |
sumlen | MAB | 1982 | 2023 | 42 | 0 |
2.1.2.3 Spatial location, scale and extent
General overview: by EPU
Indicator specifics:
Indicator | EPU |
|---|---|
falltrans | GB |
falltrans | GOM |
falltrans | MAB |
maxday | GB |
maxday | GOM |
maxday | MAB |
sprtrans | GB |
sprtrans | GOM |
sprtrans | MAB |
sumlen | GB |
sumlen | GOM |
sumlen | MAB |
2.1.3 Are methods clearly documented to obtain source data and calculate indicators?
Yes
2.1.4 Are indicator underlying source data linked or easy to find?
Data is publically available.
2.1.4.1 Where are source data stored?
Data comes from NOAA’s high resolution blended analysis of daily sea surface temperature on a 1/4 degree grid and is available online at Physical Science Labratory.
2.1.4.2 How/by whom are source data updated? Are future updates likely?
Kimberly Bastille kimberly.bastille@noaa.gov
[likelihood of source data updates requires judgement, enter by hand]
2.2 Indicator analysis/testing or history of use
2.2.1 What decision or advice processes are the indicators currently used in?
Transition dates are defined as the day of the year when surface temperatures changeover from cool to warm conditions in the spring and back to cool conditions in the fall.
2.2.2 What implications of the indicators are currently listed?
Prolonged fall temperatures have been linked to the increased number of cold-stunned Kemp’s ridley sea turtles found in Cape Cod Bay [74]
2.2.4 Have the indicators been tested to ensure they respond proportionally to a change in the underlying process?
No
3 SMART rating
Category | Indicator | Element | Attribute | Rating | ElementRating | OverallRating |
|---|---|---|---|---|---|---|
Habitat-Physical | Transition Dates | Specific | Described | 1 | 0.5000000 | 0.6333333 |
Habitat-Physical | Transition Dates | Specific | Units | 0 | 0.5000000 | 0.6333333 |
Habitat-Physical | Transition Dates | Specific | Spatial | 1 | 0.5000000 | 0.6333333 |
Habitat-Physical | Transition Dates | Specific | Uncertainty | 0 | 0.5000000 | 0.6333333 |
Habitat-Physical | Transition Dates | Specific | Methods | 1 | 0.5000000 | 0.6333333 |
Habitat-Physical | Transition Dates | Specific | Code | 0 | 0.5000000 | 0.6333333 |
Habitat-Physical | Transition Dates | Measurable | Available | 1 | 1.0000000 | 0.6333333 |
Habitat-Physical | Transition Dates | Measurable | Online | 1 | 1.0000000 | 0.6333333 |
Habitat-Physical | Transition Dates | Measurable | Contact | 1 | 1.0000000 | 0.6333333 |
Habitat-Physical | Transition Dates | Measurable | SourceDat | 1 | 1.0000000 | 0.6333333 |
Habitat-Physical | Transition Dates | Measurable | SourceAvail | 1 | 1.0000000 | 0.6333333 |
Habitat-Physical | Transition Dates | Measurable | SourceContact | 1 | 1.0000000 | 0.6333333 |
Habitat-Physical | Transition Dates | Achievable | Tested | 0 | 0.0000000 | 0.6333333 |
Habitat-Physical | Transition Dates | Achievable | Sensitivity | 0 | 0.0000000 | 0.6333333 |
Habitat-Physical | Transition Dates | Achievable | TimeLag | 0 | 0.0000000 | 0.6333333 |
Habitat-Physical | Transition Dates | Relevant | Advice | 1 | 0.6666667 | 0.6333333 |
Habitat-Physical | Transition Dates | Relevant | Implications | 1 | 0.6666667 | 0.6333333 |
Habitat-Physical | Transition Dates | Relevant | TargThresh | 0 | 0.6666667 | 0.6333333 |
Habitat-Physical | Transition Dates | Timebound | Frequency | 1 | 1.0000000 | 0.6333333 |
Habitat-Physical | Transition Dates | Timebound | Updated | 1 | 1.0000000 | 0.6333333 |
3.1 Comments
[Fill below by hand once above data complete]
3.1.1 Additional potential links to management in addition to uses listed above
3.1.2 What additional work would be needed for the Council to use the indicator?
3.1.3 What issues are caused if there is a gap or delay in data underlying the indicator