SMART Indicator Report: Spawning Timing
1 Descriptive Section
1.2 Indicator name
Spawning Timing
Includes variable(s): FALL_Haddock_GB_Developing, FALL_Haddock_GB_meanJDAY, FALL_Haddock_GB_meanTEMP, FALL_Haddock_GB_MF, FALL_Haddock_GB_Resting, FALL_Haddock_GB_Ripe, FALL_Haddock_GB_Spent, FALL_Haddock_GOM_Developing, FALL_Haddock_GOM_meanJDAY, FALL_Haddock_GOM_meanTEMP, FALL_Haddock_GOM_MF, FALL_Haddock_GOM_Resting, FALL_Haddock_GOM_Ripe, FALL_Haddock_GOM_Spent, FALL_Yellowtail_CC_Developing, FALL_Yellowtail_CC_meanJDAY, FALL_Yellowtail_CC_meanTEMP, FALL_Yellowtail_CC_MF, FALL_Yellowtail_CC_Resting, FALL_Yellowtail_CC_Ripe, FALL_Yellowtail_CC_Spent, FALL_Yellowtail_GB_Developing, FALL_Yellowtail_GB_meanJDAY, FALL_Yellowtail_GB_meanTEMP, FALL_Yellowtail_GB_MF, FALL_Yellowtail_GB_Resting, FALL_Yellowtail_GB_Ripe, FALL_Yellowtail_GB_Spent, FALL_Yellowtail_SNE_Developing, FALL_Yellowtail_SNE_meanJDAY, FALL_Yellowtail_SNE_meanTEMP, FALL_Yellowtail_SNE_MF, FALL_Yellowtail_SNE_Resting, FALL_Yellowtail_SNE_Ripe, FALL_Yellowtail_SNE_Spent, SPRING_Haddock_GB_Developing, SPRING_Haddock_GB_meanJDAY, SPRING_Haddock_GB_meanTEMP, SPRING_Haddock_GB_MF, SPRING_Haddock_GB_Resting, SPRING_Haddock_GB_Ripe, SPRING_Haddock_GB_Spent, SPRING_Haddock_GOM_Developing, SPRING_Haddock_GOM_meanJDAY, SPRING_Haddock_GOM_meanTEMP, SPRING_Haddock_GOM_MF, SPRING_Haddock_GOM_Resting, SPRING_Haddock_GOM_Ripe, SPRING_Haddock_GOM_Spent, SPRING_Yellowtail_CC_Developing, SPRING_Yellowtail_CC_meanJDAY, SPRING_Yellowtail_CC_meanTEMP, SPRING_Yellowtail_CC_MF, SPRING_Yellowtail_CC_Resting, SPRING_Yellowtail_CC_Ripe, SPRING_Yellowtail_CC_Spent, SPRING_Yellowtail_GB_Developing, SPRING_Yellowtail_GB_meanJDAY, SPRING_Yellowtail_GB_meanTEMP, SPRING_Yellowtail_GB_MF, SPRING_Yellowtail_GB_Resting, SPRING_Yellowtail_GB_Ripe, SPRING_Yellowtail_GB_Spent, SPRING_Yellowtail_SNE_Developing, SPRING_Yellowtail_SNE_meanJDAY, SPRING_Yellowtail_SNE_meanTEMP, SPRING_Yellowtail_SNE_MF, SPRING_Yellowtail_SNE_Resting, SPRING_Yellowtail_SNE_Ripe, SPRING_Yellowtail_SNE_Spent
1.3 Indicator brief description
Maturity information for groundfish is used to evaluate changes in spawning seasonality. Haddock and yellowtail flounder are included in this indicator.
1.4 Indicator visualization
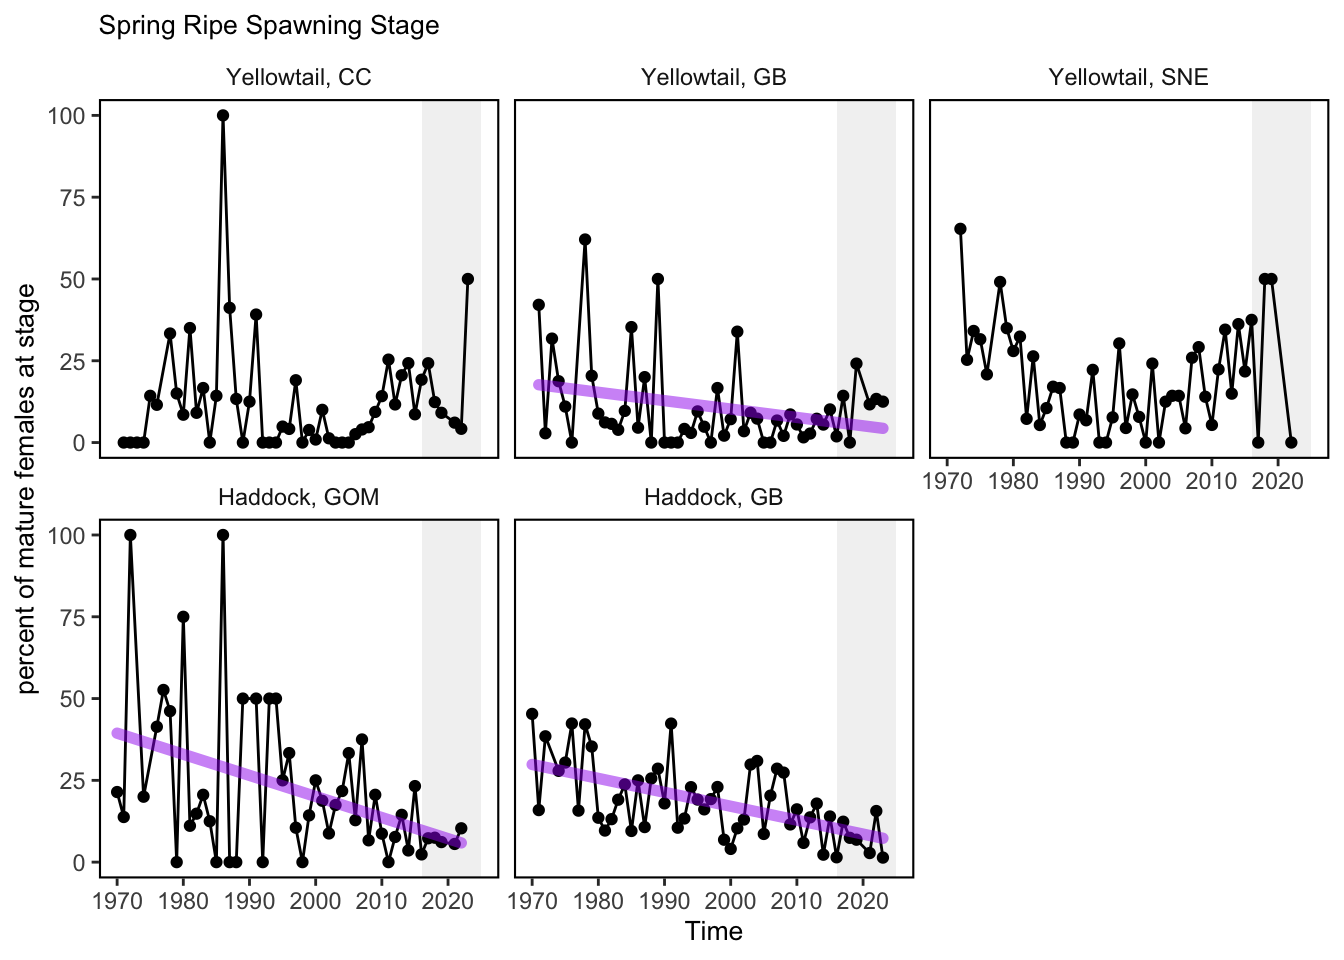
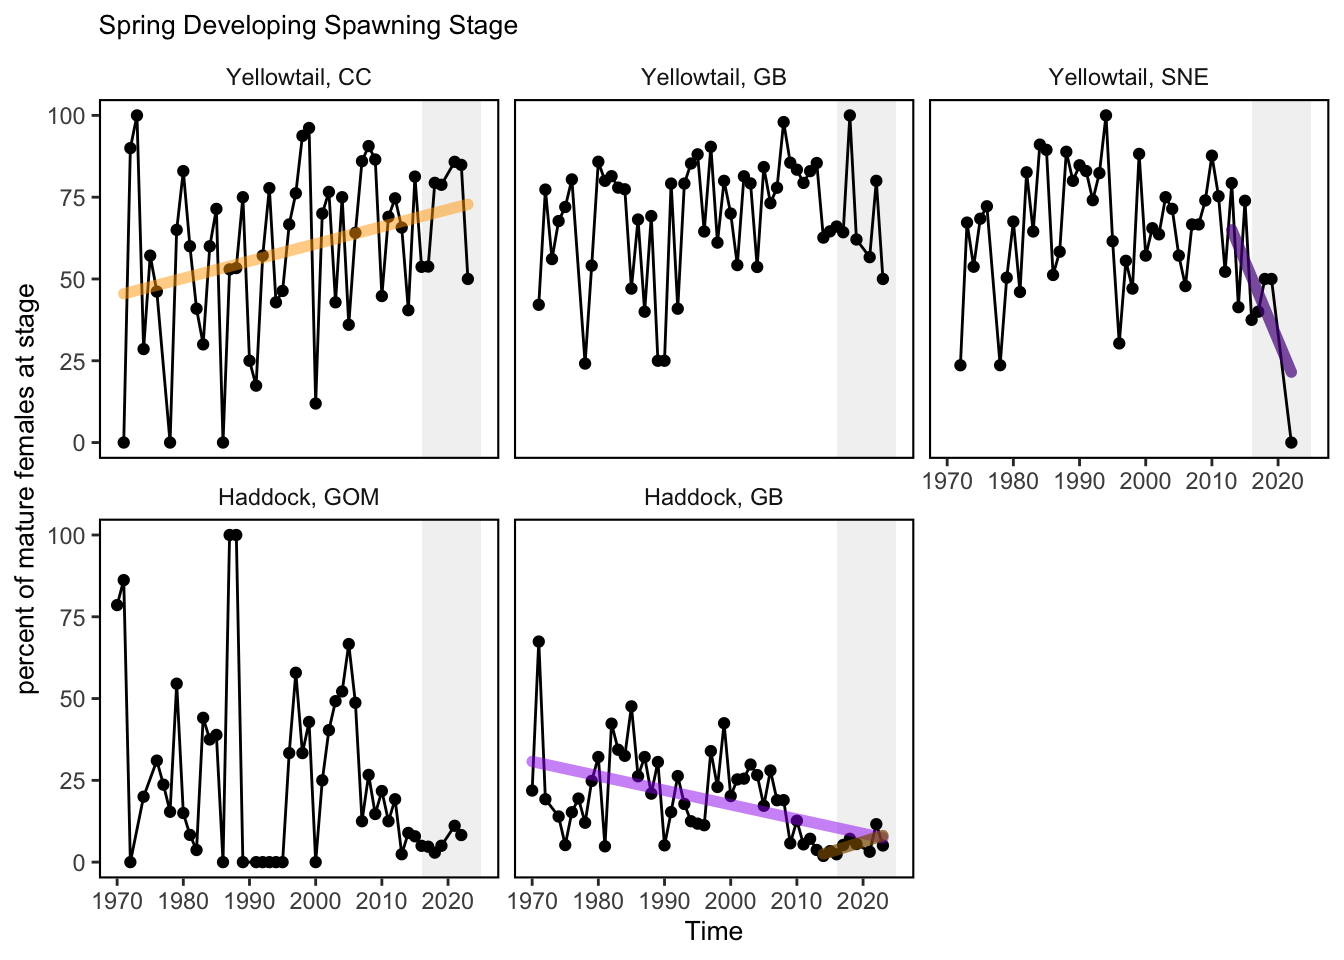
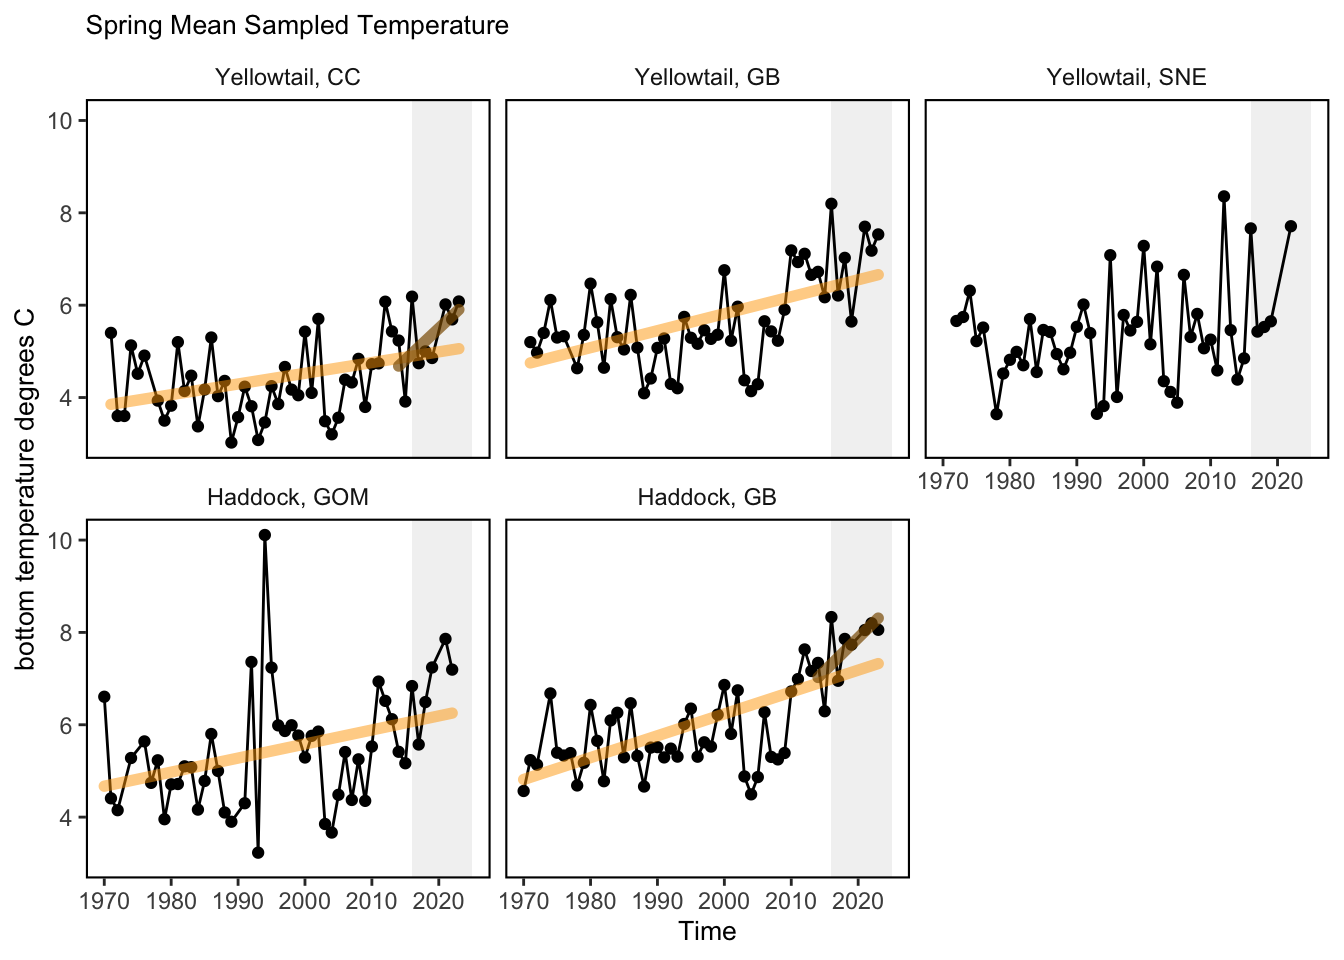
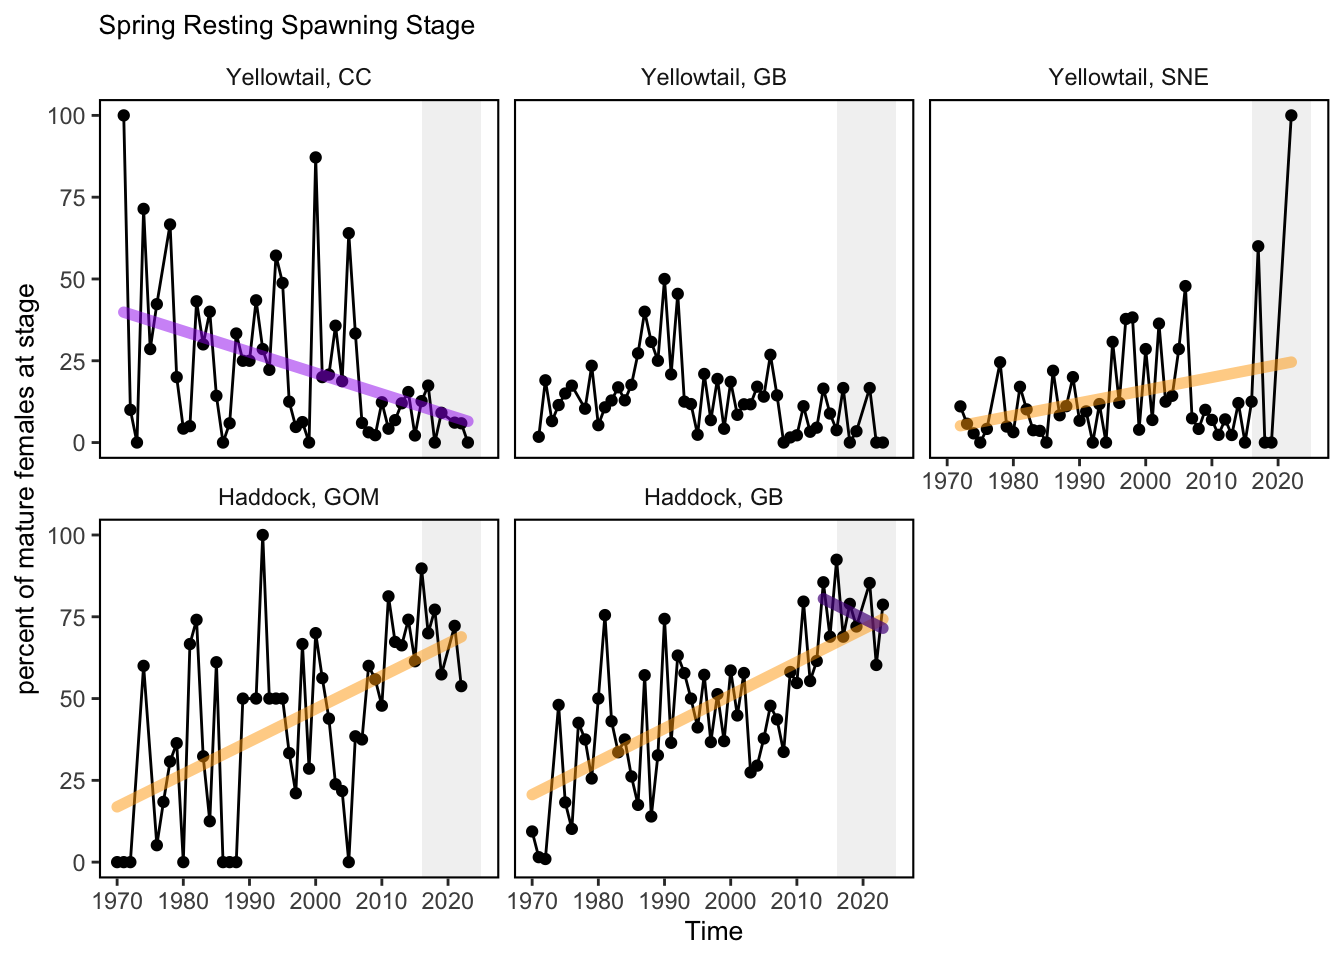
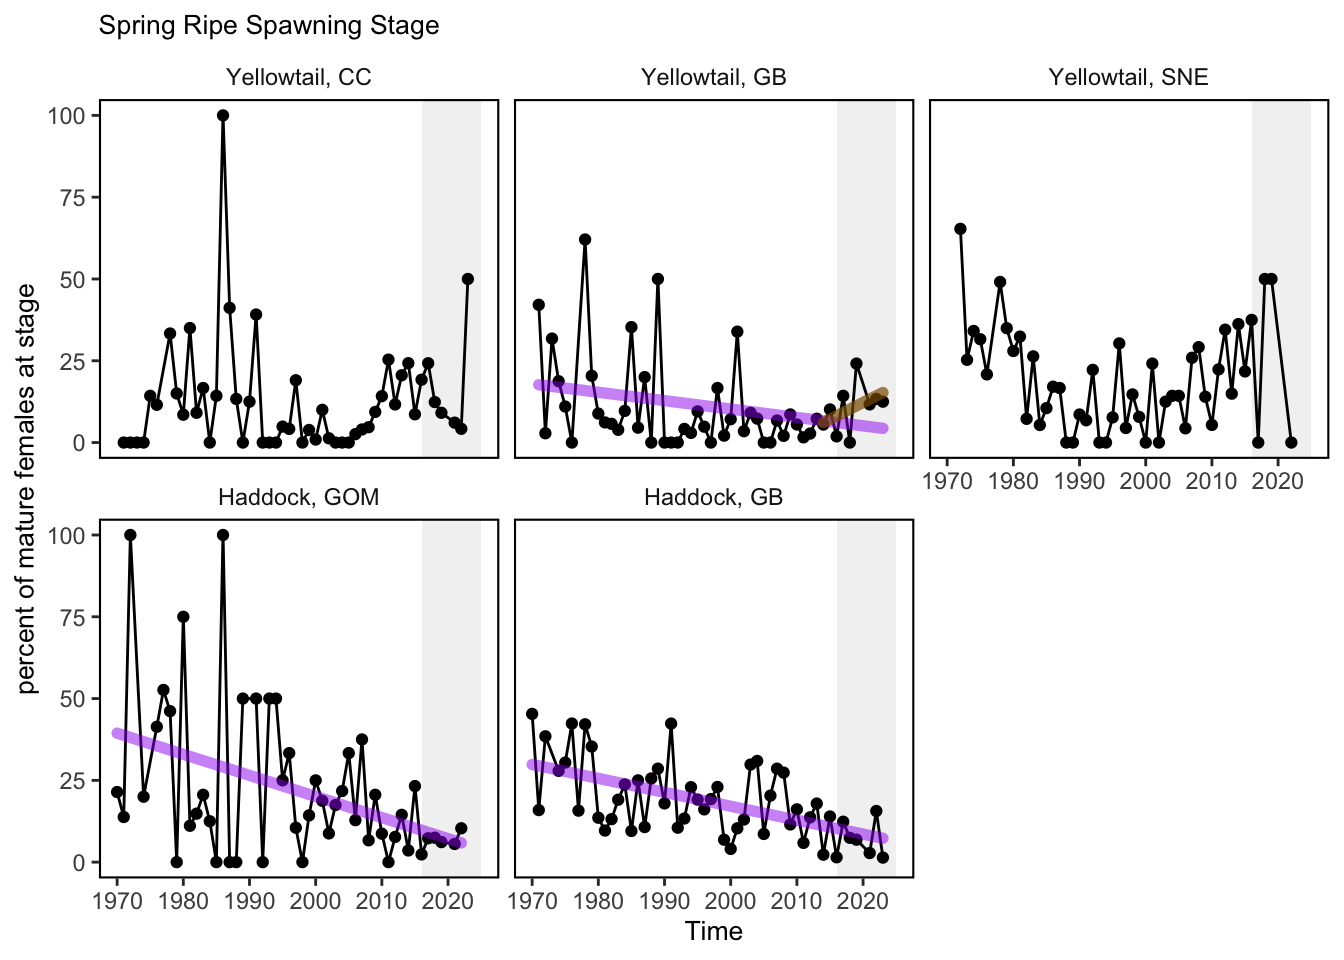
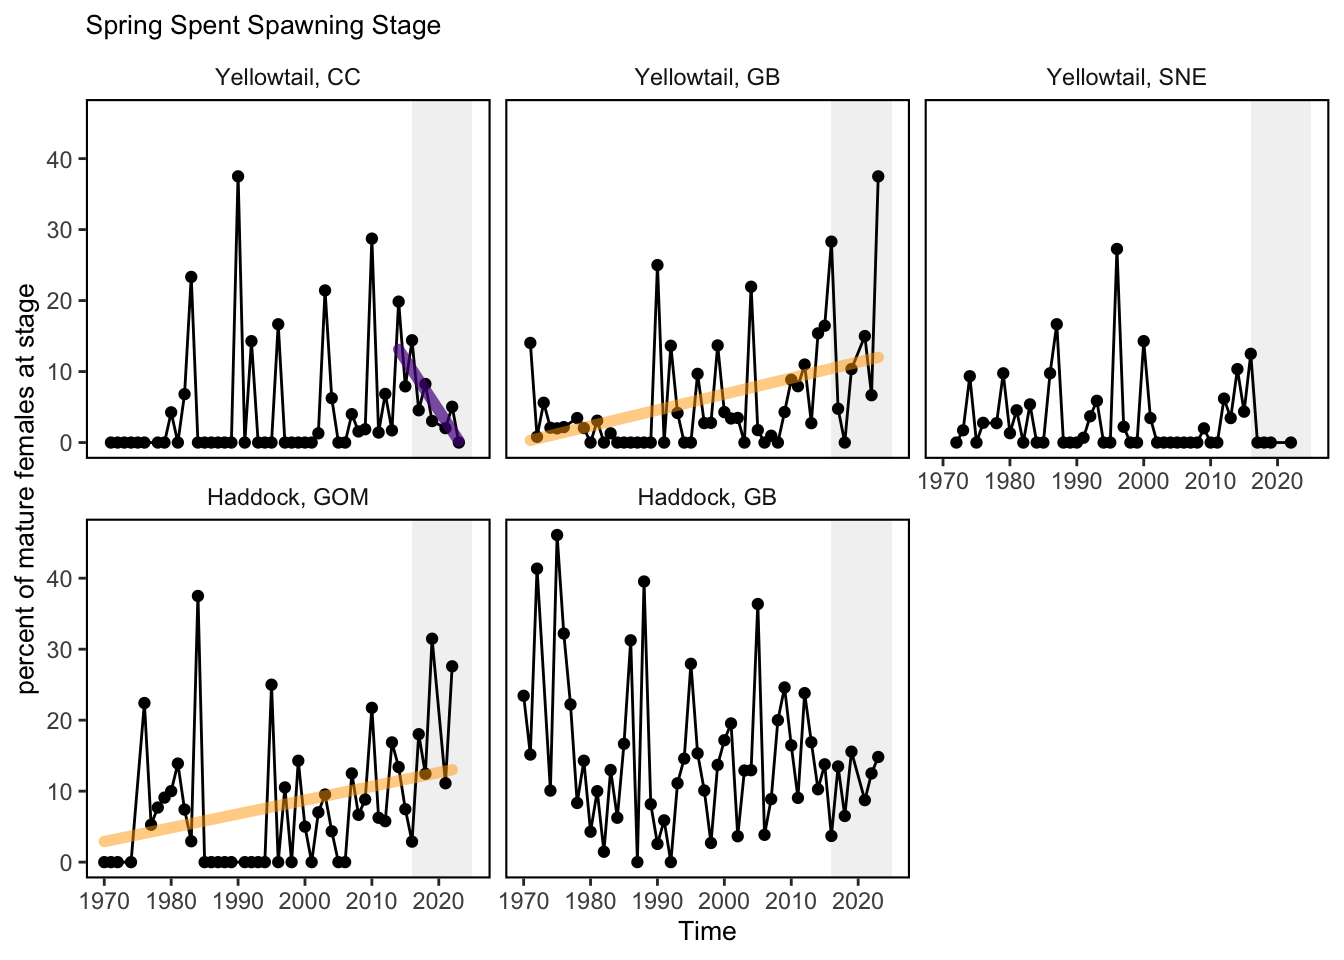
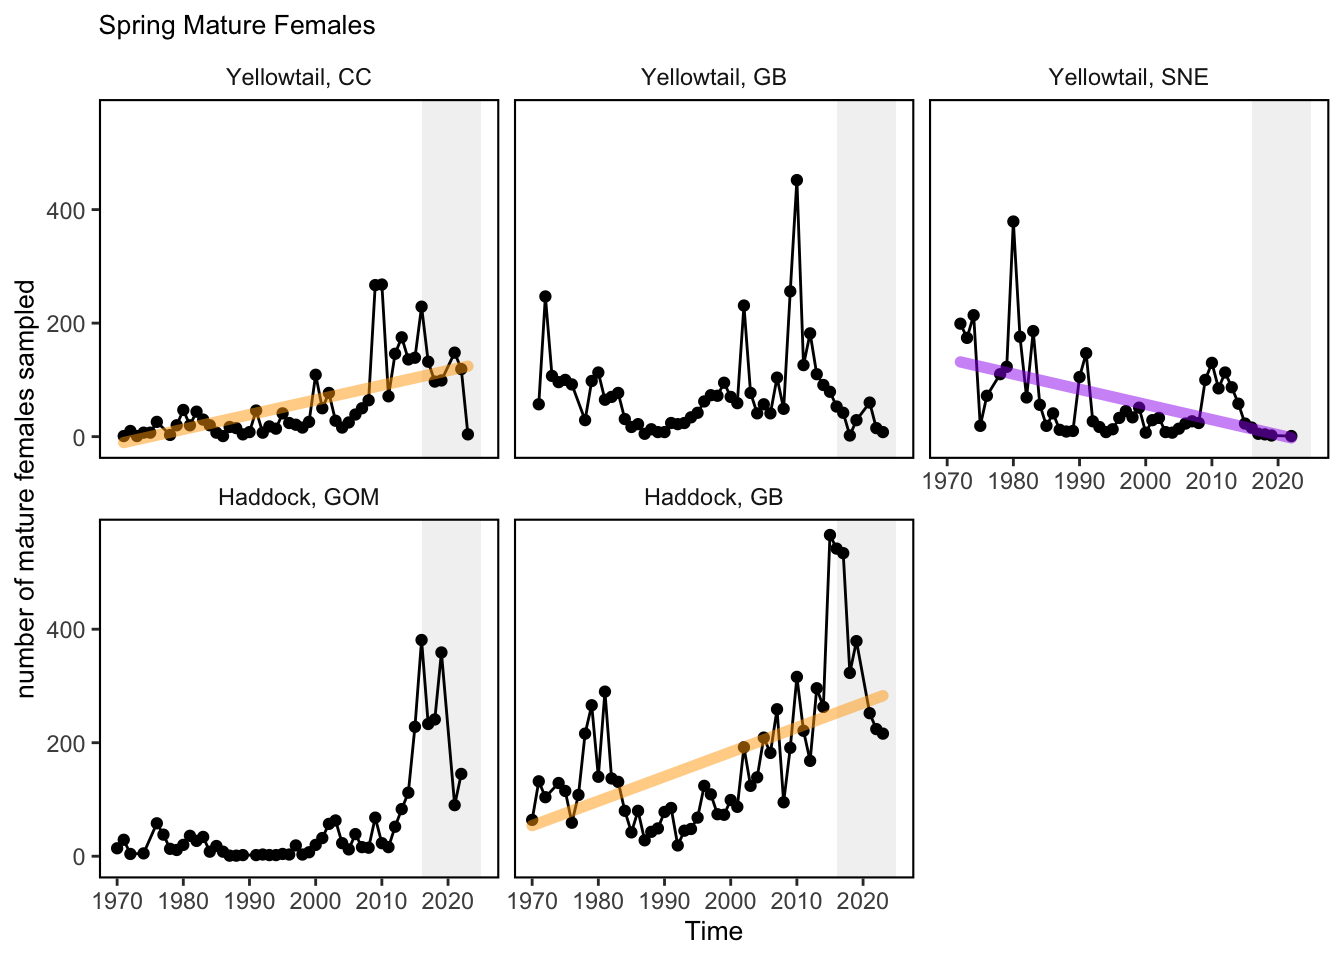
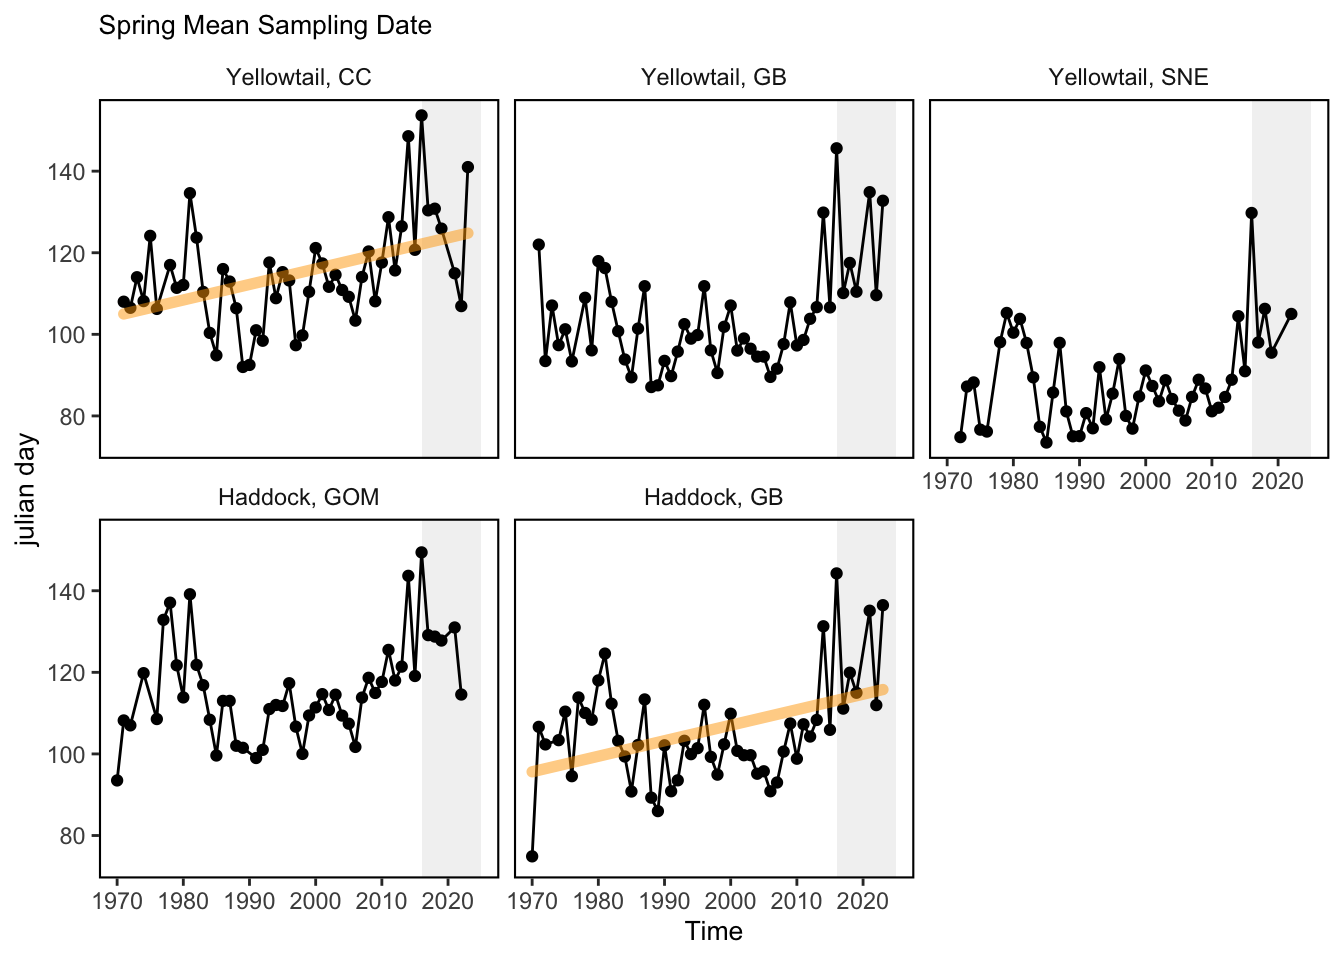
The spring bottom trawl survey (SBTS) generally occurs during the spawning season, capturing a mix of developing (spawning capable phase, sensu [46]), ripe (spawning active phase), spent (regressing phase), and resting (regenerating phase) individuals. Georges Bank and Gulf of Maine haddock The mean size of mature females sampled has declined over the time series. The time series indicates a greater proportion of post spawning fish collected at higher temperatures more recently. Although the dates sampled were similar early and late in the time series, the temperatures occurring on these dates were higher late in the time series. Spawning condition was related to bottom temperature, with samples from higher temperatures having a lower proportion of spawning active fish. Similarly, the proportion of spawning active fish declined with week of year sampled. Together, these declines in spawning activity as temperature and week of year sampled increases, indicate that the spring survey captures the peak to end of annual spawning depending on the year. When summarized by decade, the most recent decade (2010s) sampled fish at slightly warmer temperatures and had a higher percentage of resting fish as compared to the 1970s to 2000s. Sampling has also occurred later into the spring in the recent decade (2010s) and has included fewer spawning active fish (indicated by developing and ripe fish) as compared to the 1970s to 2000s that rarely sampled beyond week 18 in Georges Bank and week 20 in the Gulf of Maine. CC GOM Yellowtail Flounder The mean size of mature females sampled slightly declined early the time series. The time series indicates a lower proportion of post spawning fish collected at higher temperatures more recently. Although the dates sampled were similar early and late in the time series, the temperatures occurring on these dates was higher late in the time series. Spawning condition was related to bottom temperature, with samples from higher temperatures having a lower proportion of prespawning fish. The proportion of spawning fish increased with week of year sampled. Together, these increases in prespawning and spawning fish as temperature and week of year sampled increases, indicate that the spring survey captures the peak to end of annual spawning depending on the year. When summarized by decade, the most recent decades (2010s-2020s) sampled fish at slightly warmer temperatures and had a lower percentage of resting fish as compared to the 1970s to 2000s. Sampling has also occurred later into the spring in the recent decades (2010s-2020s) but has collected slightly higher proportions of prespawning and spawning fish combined 1970s to 2000s that had few observations beyond week 18. The multinomial model indicated significant effects of bottom temperature, week of year, and decade on the probability of individual females being in a prespawning, spawning, or postspawning condition. Pattern of increasing spawning and postspawning and decreasing prespawning with both week of year and temperate was evident. The pattern by decade indicated an increase in prespawning and decrease in postspawning groups after 2000; however, data is limited for the most recent decade. The increase in prespawning fish through time indicates sampling has shifted from the beginning or early portion of the spawning season up to the 1990s to occurring closer to the peak of the spawning season since 2000. Georges Bank Yellowtail Flounder The mean size of mature females sampled varied over the time series. The time series indicates a similar proportion of post spawning fish collected at higher temperatures more recently. Although the dates sampled were similar, early and late in the time series, with a few exceptions, the temperatures occurring on these dates was higher late in the time series. Spawning condition was related to bottom temperature, with ripe fish declining at temperatures above 8 C, spent fish increasing with temperature, but little change in developing and resting fish over the range of temperatures. The proportion of developing fish decrease, while ripe, spent and resting fish increased with week of year sampled. Together, these increases in prespawning and spawning fish as temperature and week of year sampled increases, indicate that the spring survey captures the peak to end of annual spawning depending on the year. When summarized by decade, for the most recent decades no clear patterns in the proportion of developing fish were evident, however more spent fish were encountered in the in the recent decades since 2000. Sampling has also occurred later into the spring in the recent decades (2010s-2020s) and has collected slightly higher proportions of spent and resting fish sampled at later weeks compared to the period from the 1970s to 2000s that had few observations beyond week 17. The multinomial model indicated significant effects of bottom temperature, week of year, and decade on the probability of individual females being in a prespawning, spawning, or postspawning condition. A pattern of increasing spawning and postspawning and decreasing prespawning with week of year was evident. Bottom temperature had the reverse effect, with increasing prespawing fish but decreasing spawning and spawning fish as temperature increased. The pattern by decade indicated relatively minor changes in the predicted probability of each spawning group over time, and sampling has consistently occurred close to the peak spawning period. Southern New England Yellowtail Flounder The mean size of mature females sampled varied over the time series. The time series indicates a higher proportion of ripe fish collected early and late in the time series. The dates sampled have varied over time, with later sampling occurring 1977-1982, and more recently. The bottom temperatures showed a similar pattern for the recent period, however for the earlier period sampled late in the year, the water temperatures were much lower. Spawning condition was related to bottom temperature, with ripe fish increasing at temperatures above 5 °C, spent fish increasing with temperature, developing fish decreasing and resting fish increasing over this range. At lower temperatures, the patterns were reversed, but there were fewer observations. The proportion of developing fish decreased, while ripe, spent and resting fish increased with week of year sampled. Together, these increases in spawning and postspawning fish as temperature and week of year sampled increases, indicate that the spring survey captures the peak to end of annual spawning depending on the year. When summarized by decade, the most recent decades indicate higher proportions of developing fish with subsequent declines in ripe fish compared to the earliest decade, however only a single mature female was sampled in the most recent decade. Sampling has also occurred during similar weeks (1970s-2010s) and has collected slightly higher proportions of spent and resting fish sampled in the 1990s at warmer temperatures. The multinomial model indicated significant effects of bottom temperature, week of year, and decade on the probability of individual females being in a prespawning, spawning, or postspawning condition. Pattern of increasing postspawning and decreasing spawning and prespawning with week of year was evident. The effect of bottom temperature differed, with increasing spawing and postspawning fish but decreasing prespawning fish as temperature increased. The pattern by decade indicated an increase in prespawning and decrease in spawning from the 1970s to 1990s, with little change since (ignoring the most recent decade, which is represented by a single fish). In the late 1970s and early 1980s SNE samples were collected later in the spring and contained large numbers of ripe fish, in the peak of spawning. From the mid-1980s to 2010 sampling occurred earlier and collected mostly prespawning fish.


2 SMART Attribute Section
2.1 Indicator documentation
2.1.1 Are indicators available for others to use (data downloadable)?
Yes
2.1.1.1 Where can indicators be found?
Data: https://noaa-edab.github.io/ecodata/index.html
Description: https://noaa-edab.github.io/catalog/spawn_timing.html
Technical documentation: https://noaa-edab.github.io/tech-doc/spawn_timing.html
2.1.1.2 How often are they updated? Are future updates likely?
[need sequential look at datasets for update frequency. Future requires judgement]
2.1.1.3 Who is the contact?
Mark Wuenschel mark.wuenschel@noaa.gov
2.1.2 Gather indicator statistics
2.1.2.1 Units
Indicator | Units |
|---|---|
FALL_Haddock_GB_Developing | percent of mature females at stage |
FALL_Haddock_GB_meanJDAY | julian day |
FALL_Haddock_GB_meanTEMP | bottom temperature degrees C |
FALL_Haddock_GB_MF | number of mature females sampled |
FALL_Haddock_GB_Resting | percent of mature females at stage |
FALL_Haddock_GB_Ripe | percent of mature females at stage |
FALL_Haddock_GB_Spent | percent of mature females at stage |
FALL_Haddock_GOM_Developing | percent of mature females at stage |
FALL_Haddock_GOM_meanJDAY | julian day |
FALL_Haddock_GOM_meanTEMP | bottom temperature degrees C |
FALL_Haddock_GOM_MF | number of mature females sampled |
FALL_Haddock_GOM_Resting | percent of mature females at stage |
FALL_Haddock_GOM_Ripe | percent of mature females at stage |
FALL_Haddock_GOM_Spent | percent of mature females at stage |
FALL_Yellowtail_CC_Developing | percent of mature females at stage |
FALL_Yellowtail_CC_meanJDAY | julian day |
FALL_Yellowtail_CC_meanTEMP | bottom temperature degrees C |
FALL_Yellowtail_CC_MF | number of mature females sampled |
FALL_Yellowtail_CC_Resting | percent of mature females at stage |
FALL_Yellowtail_CC_Ripe | percent of mature females at stage |
FALL_Yellowtail_CC_Spent | percent of mature females at stage |
FALL_Yellowtail_GB_Developing | percent of mature females at stage |
FALL_Yellowtail_GB_meanJDAY | julian day |
FALL_Yellowtail_GB_meanTEMP | bottom temperature degrees C |
FALL_Yellowtail_GB_MF | number of mature females sampled |
FALL_Yellowtail_GB_Resting | percent of mature females at stage |
FALL_Yellowtail_GB_Ripe | percent of mature females at stage |
FALL_Yellowtail_GB_Spent | percent of mature females at stage |
FALL_Yellowtail_SNE_Developing | percent of mature females at stage |
FALL_Yellowtail_SNE_meanJDAY | julian day |
FALL_Yellowtail_SNE_meanTEMP | bottom temperature degrees C |
FALL_Yellowtail_SNE_MF | number of mature females sampled |
FALL_Yellowtail_SNE_Resting | percent of mature females at stage |
FALL_Yellowtail_SNE_Ripe | percent of mature females at stage |
FALL_Yellowtail_SNE_Spent | percent of mature females at stage |
SPRING_Haddock_GB_Developing | percent of mature females at stage |
SPRING_Haddock_GB_meanJDAY | julian day |
SPRING_Haddock_GB_meanTEMP | bottom temperature degrees C |
SPRING_Haddock_GB_MF | number of mature females sampled |
SPRING_Haddock_GB_Resting | percent of mature females at stage |
SPRING_Haddock_GB_Ripe | percent of mature females at stage |
SPRING_Haddock_GB_Spent | percent of mature females at stage |
SPRING_Haddock_GOM_Developing | percent of mature females at stage |
SPRING_Haddock_GOM_meanJDAY | julian day |
SPRING_Haddock_GOM_meanTEMP | bottom temperature degrees C |
SPRING_Haddock_GOM_MF | number of mature females sampled |
SPRING_Haddock_GOM_Resting | percent of mature females at stage |
SPRING_Haddock_GOM_Ripe | percent of mature females at stage |
SPRING_Haddock_GOM_Spent | percent of mature females at stage |
SPRING_Yellowtail_CC_Developing | percent of mature females at stage |
SPRING_Yellowtail_CC_meanJDAY | julian day |
SPRING_Yellowtail_CC_meanTEMP | bottom temperature degrees C |
SPRING_Yellowtail_CC_MF | number of mature females sampled |
SPRING_Yellowtail_CC_Resting | percent of mature females at stage |
SPRING_Yellowtail_CC_Ripe | percent of mature females at stage |
SPRING_Yellowtail_CC_Spent | percent of mature females at stage |
SPRING_Yellowtail_GB_Developing | percent of mature females at stage |
SPRING_Yellowtail_GB_meanJDAY | julian day |
SPRING_Yellowtail_GB_meanTEMP | bottom temperature degrees C |
SPRING_Yellowtail_GB_MF | number of mature females sampled |
SPRING_Yellowtail_GB_Resting | percent of mature females at stage |
SPRING_Yellowtail_GB_Ripe | percent of mature females at stage |
SPRING_Yellowtail_GB_Spent | percent of mature females at stage |
SPRING_Yellowtail_SNE_Developing | percent of mature females at stage |
SPRING_Yellowtail_SNE_meanJDAY | julian day |
SPRING_Yellowtail_SNE_meanTEMP | bottom temperature degrees C |
SPRING_Yellowtail_SNE_MF | number of mature females sampled |
SPRING_Yellowtail_SNE_Resting | percent of mature females at stage |
SPRING_Yellowtail_SNE_Ripe | percent of mature females at stage |
SPRING_Yellowtail_SNE_Spent | percent of mature females at stage |
2.1.2.2 Length of time series, start and end date, periodicity
General overview: Spring and Fall
Indicator specifics:
Indicator | EPU | StartYear | EndYear | NumYears | MissingYears |
|---|---|---|---|---|---|
FALL_Haddock_GB_Developing | 1966 | 2023 | 51 | 7 | |
FALL_Haddock_GB_meanJDAY | 1966 | 2023 | 51 | 7 | |
FALL_Haddock_GB_meanTEMP | 1966 | 2023 | 51 | 7 | |
FALL_Haddock_GB_MF | 1966 | 2023 | 51 | 7 | |
FALL_Haddock_GB_Resting | 1966 | 2023 | 51 | 7 | |
FALL_Haddock_GB_Ripe | 1966 | 2023 | 51 | 7 | |
FALL_Haddock_GB_Spent | 1966 | 2023 | 51 | 7 | |
FALL_Haddock_GOM_Developing | 1966 | 2023 | 49 | 9 | |
FALL_Haddock_GOM_meanJDAY | 1966 | 2023 | 49 | 9 | |
FALL_Haddock_GOM_meanTEMP | 1966 | 2023 | 49 | 9 | |
FALL_Haddock_GOM_MF | 1966 | 2023 | 49 | 9 | |
FALL_Haddock_GOM_Resting | 1966 | 2023 | 49 | 9 | |
FALL_Haddock_GOM_Ripe | 1966 | 2023 | 49 | 9 | |
FALL_Haddock_GOM_Spent | 1966 | 2023 | 49 | 9 | |
FALL_Yellowtail_CC_Developing | 1971 | 2023 | 42 | 11 | |
FALL_Yellowtail_CC_meanJDAY | 1971 | 2023 | 42 | 11 | |
FALL_Yellowtail_CC_meanTEMP | 1971 | 2023 | 42 | 11 | |
FALL_Yellowtail_CC_MF | 1971 | 2023 | 42 | 11 | |
FALL_Yellowtail_CC_Resting | 1971 | 2023 | 42 | 11 | |
FALL_Yellowtail_CC_Ripe | 1971 | 2023 | 42 | 11 | |
FALL_Yellowtail_CC_Spent | 1971 | 2023 | 42 | 11 | |
FALL_Yellowtail_GB_Developing | 1971 | 2023 | 41 | 12 | |
FALL_Yellowtail_GB_meanJDAY | 1971 | 2023 | 41 | 12 | |
FALL_Yellowtail_GB_meanTEMP | 1971 | 2023 | 41 | 12 | |
FALL_Yellowtail_GB_MF | 1971 | 2023 | 41 | 12 | |
FALL_Yellowtail_GB_Resting | 1971 | 2023 | 41 | 12 | |
FALL_Yellowtail_GB_Ripe | 1971 | 2023 | 41 | 12 | |
FALL_Yellowtail_GB_Spent | 1971 | 2023 | 41 | 12 | |
FALL_Yellowtail_SNE_Developing | 1971 | 2023 | 40 | 13 | |
FALL_Yellowtail_SNE_meanJDAY | 1971 | 2023 | 40 | 13 | |
FALL_Yellowtail_SNE_meanTEMP | 1971 | 2023 | 40 | 13 | |
FALL_Yellowtail_SNE_MF | 1971 | 2023 | 40 | 13 | |
FALL_Yellowtail_SNE_Resting | 1971 | 2023 | 40 | 13 | |
FALL_Yellowtail_SNE_Ripe | 1971 | 2023 | 40 | 13 | |
FALL_Yellowtail_SNE_Spent | 1971 | 2023 | 40 | 13 | |
SPRING_Haddock_GB_Developing | 1970 | 2023 | 52 | 2 | |
SPRING_Haddock_GB_meanJDAY | 1970 | 2023 | 52 | 2 | |
SPRING_Haddock_GB_meanTEMP | 1970 | 2023 | 52 | 2 | |
SPRING_Haddock_GB_MF | 1970 | 2023 | 52 | 2 | |
SPRING_Haddock_GB_Resting | 1970 | 2023 | 52 | 2 | |
SPRING_Haddock_GB_Ripe | 1970 | 2023 | 52 | 2 | |
SPRING_Haddock_GB_Spent | 1970 | 2023 | 52 | 2 | |
SPRING_Haddock_GOM_Developing | 1970 | 2022 | 49 | 4 | |
SPRING_Haddock_GOM_meanJDAY | 1970 | 2022 | 49 | 4 | |
SPRING_Haddock_GOM_meanTEMP | 1970 | 2022 | 49 | 4 | |
SPRING_Haddock_GOM_MF | 1970 | 2022 | 49 | 4 | |
SPRING_Haddock_GOM_Resting | 1970 | 2022 | 49 | 4 | |
SPRING_Haddock_GOM_Ripe | 1970 | 2022 | 49 | 4 | |
SPRING_Haddock_GOM_Spent | 1970 | 2022 | 49 | 4 | |
SPRING_Yellowtail_CC_Developing | 1971 | 2023 | 51 | 2 | |
SPRING_Yellowtail_CC_meanJDAY | 1971 | 2023 | 51 | 2 | |
SPRING_Yellowtail_CC_meanTEMP | 1971 | 2023 | 51 | 2 | |
SPRING_Yellowtail_CC_MF | 1971 | 2023 | 51 | 2 | |
SPRING_Yellowtail_CC_Resting | 1971 | 2023 | 51 | 2 | |
SPRING_Yellowtail_CC_Ripe | 1971 | 2023 | 51 | 2 | |
SPRING_Yellowtail_CC_Spent | 1971 | 2023 | 51 | 2 | |
SPRING_Yellowtail_GB_Developing | 1971 | 2023 | 51 | 2 | |
SPRING_Yellowtail_GB_meanJDAY | 1971 | 2023 | 51 | 2 | |
SPRING_Yellowtail_GB_meanTEMP | 1971 | 2023 | 51 | 2 | |
SPRING_Yellowtail_GB_MF | 1971 | 2023 | 51 | 2 | |
SPRING_Yellowtail_GB_Resting | 1971 | 2023 | 51 | 2 | |
SPRING_Yellowtail_GB_Ripe | 1971 | 2023 | 51 | 2 | |
SPRING_Yellowtail_GB_Spent | 1971 | 2023 | 51 | 2 | |
SPRING_Yellowtail_SNE_Developing | 1972 | 2022 | 48 | 3 | |
SPRING_Yellowtail_SNE_meanJDAY | 1972 | 2022 | 48 | 3 | |
SPRING_Yellowtail_SNE_meanTEMP | 1972 | 2022 | 48 | 3 | |
SPRING_Yellowtail_SNE_MF | 1972 | 2022 | 48 | 3 | |
SPRING_Yellowtail_SNE_Resting | 1972 | 2022 | 48 | 3 | |
SPRING_Yellowtail_SNE_Ripe | 1972 | 2022 | 48 | 3 | |
SPRING_Yellowtail_SNE_Spent | 1972 | 2022 | 48 | 3 |
2.1.2.3 Spatial location, scale and extent
General overview: Stock-specific spatial scale
Indicator specifics:
Indicator | EPU |
|---|---|
FALL_Haddock_GB_Developing | |
FALL_Haddock_GB_meanJDAY | |
FALL_Haddock_GB_meanTEMP | |
FALL_Haddock_GB_MF | |
FALL_Haddock_GB_Resting | |
FALL_Haddock_GB_Ripe | |
FALL_Haddock_GB_Spent | |
FALL_Haddock_GOM_Developing | |
FALL_Haddock_GOM_meanJDAY | |
FALL_Haddock_GOM_meanTEMP | |
FALL_Haddock_GOM_MF | |
FALL_Haddock_GOM_Resting | |
FALL_Haddock_GOM_Ripe | |
FALL_Haddock_GOM_Spent | |
FALL_Yellowtail_CC_Developing | |
FALL_Yellowtail_CC_meanJDAY | |
FALL_Yellowtail_CC_meanTEMP | |
FALL_Yellowtail_CC_MF | |
FALL_Yellowtail_CC_Resting | |
FALL_Yellowtail_CC_Ripe | |
FALL_Yellowtail_CC_Spent | |
FALL_Yellowtail_GB_Developing | |
FALL_Yellowtail_GB_meanJDAY | |
FALL_Yellowtail_GB_meanTEMP | |
FALL_Yellowtail_GB_MF | |
FALL_Yellowtail_GB_Resting | |
FALL_Yellowtail_GB_Ripe | |
FALL_Yellowtail_GB_Spent | |
FALL_Yellowtail_SNE_Developing | |
FALL_Yellowtail_SNE_meanJDAY | |
FALL_Yellowtail_SNE_meanTEMP | |
FALL_Yellowtail_SNE_MF | |
FALL_Yellowtail_SNE_Resting | |
FALL_Yellowtail_SNE_Ripe | |
FALL_Yellowtail_SNE_Spent | |
SPRING_Haddock_GB_Developing | |
SPRING_Haddock_GB_meanJDAY | |
SPRING_Haddock_GB_meanTEMP | |
SPRING_Haddock_GB_MF | |
SPRING_Haddock_GB_Resting | |
SPRING_Haddock_GB_Ripe | |
SPRING_Haddock_GB_Spent | |
SPRING_Haddock_GOM_Developing | |
SPRING_Haddock_GOM_meanJDAY | |
SPRING_Haddock_GOM_meanTEMP | |
SPRING_Haddock_GOM_MF | |
SPRING_Haddock_GOM_Resting | |
SPRING_Haddock_GOM_Ripe | |
SPRING_Haddock_GOM_Spent | |
SPRING_Yellowtail_CC_Developing | |
SPRING_Yellowtail_CC_meanJDAY | |
SPRING_Yellowtail_CC_meanTEMP | |
SPRING_Yellowtail_CC_MF | |
SPRING_Yellowtail_CC_Resting | |
SPRING_Yellowtail_CC_Ripe | |
SPRING_Yellowtail_CC_Spent | |
SPRING_Yellowtail_GB_Developing | |
SPRING_Yellowtail_GB_meanJDAY | |
SPRING_Yellowtail_GB_meanTEMP | |
SPRING_Yellowtail_GB_MF | |
SPRING_Yellowtail_GB_Resting | |
SPRING_Yellowtail_GB_Ripe | |
SPRING_Yellowtail_GB_Spent | |
SPRING_Yellowtail_SNE_Developing | |
SPRING_Yellowtail_SNE_meanJDAY | |
SPRING_Yellowtail_SNE_meanTEMP | |
SPRING_Yellowtail_SNE_MF | |
SPRING_Yellowtail_SNE_Resting | |
SPRING_Yellowtail_SNE_Ripe | |
SPRING_Yellowtail_SNE_Spent |
2.1.3 Are methods clearly documented to obtain source data and calculate indicators?
Yes
2.1.3.1 Can the indicator be calculated from current documentation?
Input datasets are available at: https://github.com/sgaichas/spawntiming
The same series of summary/diagnostic plots are presented for each species and stock area. The data summaries allow visual interpretation of patterns and trends. The function ecodata::geom_gls was applied to detect trends. Multinomial regression results are reported but figures not shown in catalog. For yellowtail flounder, multinomial logistic regression was used to summarize and evaluate the relative significance of sampling week, bottom temperature, and time block on the spawning condition of fish sampled during spring surveys. For this analysis, developing fish were considered ‘prespawning’, both ripe and ripe and running classes were considered ‘spawning’, and the spent and resting classes were combined into ‘postspawning’. Although there is some order to these three classifications, they represent more of a cycle, and given Yellowtail Flounder are batch spawners and go from developing to ripe and back to developing multiple times before becoming spent. Therefore, multinomial regression was chosen over ordinal regression. The stock specific multinomial log- linear models took the form: (Spawning condition) ~ (Week of year) + (Bottom Temperature) + (Time block) Where spawning condition of individual fish is Prespawning, spawning, postspawning; as outlined above), Week of Year, Bottom Temperature (°C), and Time block (10year periods) are associated with each sample. Models were fit using multinom function in the nnet library (Venables et al. 2002) in R with Hess= True to calculate coefficient standard errors. The three probabilities (prespawning, spawning, postspawning) sum to one, only two need to be estimated. The resulting odds ratios were used to estimate probabilities using the R package ggeffects (Lüdecke 2018) for visualizations of marginal effects. The significance of variables in the model was evaluated with likelihood ratio test using Anova in the R package (car) (Fox et al. 2012).
2.1.4 Are indicator underlying source data linked or easy to find?
Source data are publicly available.
2.1.4.1 Where are source data stored?
Spawning phenology of haddock and yellowtail flounder was evaluated using macroscopic maturity data collected during routine NEFSC spring and fall bottom trawl surveys. The macroscopic maturity classification scheme includes six stages – immature, developing, ripe, running ripe, spent, and resting- and criteria are described in Burnett et al. (1989). Beginning in the fall of 2006, the classification of ripe changed, from >50% of eggs hydrated (clear) to the presence of any hydrated eggs. In this scheme, fish mature once in their life, and then cycle through developing to resting stages annually. As batch spawners, haddock and yellowtail flounder would be developing leading up to spawning, then undergo cycles of ripe and running ripe as individual batches mature, hydrate and are released. After each batch is released, they would return to a developing stage and repeat until the last batch is released, after which they would proceed to the spent and resting stages. Therefore individuals in the developing stage could either be prespawning, or in between batches, which cannot be distinguished macroscopically (ovarian histology can differentiate these two based on the presence of postovulatory follicles). At the population level, the occurrence of developing fish with some ripe is indicative of active spawning. The present analysis is restricted to mature females, since males are generally prepared to spawn over a broader time period than females. Histological verification of the macroscopic staging, and formal quantification of error rates have not been evaluated for haddock or yellowtail flounder. However, for species that have been evaluated, the error rates have been relatively low (McBride et al. (2013), Wuenschel and Deroba (2019)). The rates of misclassifications are minor compared to the volume of correct classifications.
2.1.4.2 How/by whom are source data updated? Are future updates likely?
Mark Wuenschel mark.wuenschel@noaa.gov
[likelihood of source data updates requires judgement, enter by hand]
2.2 Indicator analysis/testing or history of use
2.2.1 What decision or advice processes are the indicators currently used in?
Spawning phenology, the annual timing of reproduction, determines when spawning occurs and is therefore important to understanding individual fish energetics and condition, as well as the timing and location of release of eggs. Fish undergo seasonal (annual) patterns of weight gain and loss related to spawning. In some extreme cases, gonad weight can be > 30% body weight, therefore estimates of fish condition based on fish weight can be influenced by reproductive state. Thus, shifts in survey timing and/or spawning seasonality over time could produce changes in calculated weight based condition indices. Maturity data collected on NEFSC bottom trawl surveys were evaluated to determine spawning seasonality for haddock and yellowtail flounder, and to investigate if this may have changed over the available time series of data. These indicators were presented as working papers to the haddock and yellowtail flounder assessment working groups, and text from those working papers is reproduced here.
2.2.2 What implications of the indicators are currently listed?
Spawning timing is shifting earlier for multiple stocks, including haddock and yellowtail flounder. Spawning of both haddock stocks occurred earlier in the year (and ended earlier, as indicated by more resting (post-spawning) stage fish, in the 2010s as compared to earlier in the time series. Yellowtail flounder spawn late spring-summer, with timing varying by stock location. The northern (CC/GOM) stock shows earlier active spawning in recent years with a decline in pre-spawning resting females. Both GB and SNE stock are sampled during active spawning (low percent resting). The recent increase in resting females in the southern (SNE) stock also indicates a shift to earlier spawning (i.e. more post-spawn fish). Yellowtail flounder spawning is related to bottom temperature, week of year, and decade sampled for each of the three stocks. Haddock spawn during the late winter-spring months in the region, with the spring survey sampling fish in the latter portion of the spawning season (peak to end). There is evidence that spawning of both haddock stocks occurred earlier in the year (and ended earlier) in the recent decade (2010s) as compared to earlier in the time series. Recent spring surveys have sampled a greater proportion of post spawning fish. The post spawning haddock would be expected to have lower relative condition due to shedding of gametes, depletion of liver (used for oocyte development and maturation), and higher water content of muscle and liver tissue, as has been reported in cod ([47]) and flatfishes ([48]). Some fishes also reduce or cease feeding during spawning, for behavioral or physical (gonad occupying most of the body cavity) reasons. The annual cycle of energy acquisition, storage, and depletion is lowest immediately following spawning in capital breeders such as haddock ([49]). Trippel and Neil [50] estimated female weight loss associated with spawning to be 24.1% in a laboratory study of haddock. Although the reduction in weight and condition due to spawning is temporary, comparisons of relative condition (weight at length) across years that sampled varying proportions of active and post spawning fish (whether due to spawning timing or survey timing) should be considered with caution. The results presented for mature females should be applicable to mature males as well, but immature fish of both sexes will not undergo weight loss due to spawning. Therefore comparison of condition in proximity to spawning season across years that contain varying proportions of immature and mature fish will also be problematic. Given the temporal separation from spawning, relative condition estimates derived from autumn surveys will be less influenced by alterations in timing of surveys or spawning season. Yellowtail Flounder spawn during the spring months in the region, with the spring survey sampling fish during the spawning season. There is evidence that spawning condition is related to the bottom temperature, week of year, and decade sampled for each of the three stocks and survey timing and environmental conditions (bottom temperature) have been variable over time. The analysis of macroscopic data presented here provides some evidence for a change in the spawning season of CC GOM and SNE stocks. Early in the time series, sampling captured the beginning/early portion of spawning season, while later in the time series sampling has captured more of the peak in spawning. However, some caveats to this general conclusion are warranted. First, since Yellowtail Flounder are batch spawners, individuals cycle from developing, to ripe, to running ripe, and back to developing for each of many batches over a >1 month period. As such, the developing class includes a mix of individuals that have not released any batches yet (true prespawners) and others who are ’in between batches (i.e. partially spent, but before a next batch). Gonadal histology and/or GSI data could help to refine categorization of these stages, but such data does not exist for the long time series presented. Second, the analysis by decadal timeblocks presented is a rather coarse approach to investigating long term trends in spawning condition. More appropriate methods should be explored and evaluated in future studies. Nevertheless, even with significant inter-annual variability, the approach presented should detect directional change in spawning seasonality over the time series. Subtle shifts to earlier spawning, accompanied by more individuals sampled later in their annual reproductive cycle (e.g. closer to spent), were evident in CC GOM and SNE stocks. Even small changes in spawning seasonality and/or sampling timing can affect the total weight of individuals sampled given the gonad of Yellowtail Flounder females can reach 35 % of their body weight ([51]), with the ovary declining in weight over a period of months as batches of eggs are shed. Therefore, consideration of spawning condition when interpreting fish weight and relative condition during the spring season should be considered. Although sampling was not specifically designed to detect changes in spawning seasonality of Yellowtail Flounder, the present analysis provides a preliminary evaluation of spawning timing over a long time series (1971-2023). The post spawning Yellowtail Flounder would be expected to have lower relative condition due to shedding of gametes, depletion of liver (used for oocyte development and maturation), and higher water content of muscle and liver tissue, as has been reported in cod ([47]) and flatfishes ([48]). Some fishes also reduce or cease feeding during spawning, for behavioral or physical (e.g. gonad occupying most of the body cavity) reasons. The annual cycle of energy acquisition, storage, and depletion is lowest immediately following spawning in capital breeders such as haddock ([49]). Manning and Crim [52] estimated female weight loss associated with spawning to be 22-23% in a laboratory study of Yellowtail Flounder. Although the reduction in weight and condition due to spawning is temporary, comparisons of relative condition (weight at length) across years that sampled varying proportions of active and post spawning fish (whether due to spawning timing or survey timing) should be considered with caution. The results presented for mature females should be applicable to mature males as well, but immature fish of both sexes will not undergo weight loss due to spawning. Therefore, comparison of condition in proximity to spawning season across years that contain varying proportions of immature and mature fish will also be problematic. Given the temporal separation from spawning, relative condition estimates derived from autumn surveys will be less influenced by alterations in timing of surveys or spawning season.
2.2.3 Do target, limit, or threshold values already exist for the indicator?
Target, limit, or threshold terms detected
2.2.4 Have the indicators been tested to ensure they respond proportionally to a change in the underlying process?
Simulation or test terms detected
3 SMART rating
Category | Indicator | Element | Attribute | Rating | ElementRating | OverallRating |
|---|---|---|---|---|---|---|
Fish | Spawning Timing | Specific | Described | 1.0 | 0.8333333 | 0.85 |
Fish | Spawning Timing | Specific | Units | 1.0 | 0.8333333 | 0.85 |
Fish | Spawning Timing | Specific | Spatial | 1.0 | 0.8333333 | 0.85 |
Fish | Spawning Timing | Specific | Uncertainty | 0.0 | 0.8333333 | 0.85 |
Fish | Spawning Timing | Specific | Methods | 1.0 | 0.8333333 | 0.85 |
Fish | Spawning Timing | Specific | Code | 1.0 | 0.8333333 | 0.85 |
Fish | Spawning Timing | Measurable | Available | 1.0 | 1.0000000 | 0.85 |
Fish | Spawning Timing | Measurable | Online | 1.0 | 1.0000000 | 0.85 |
Fish | Spawning Timing | Measurable | Contact | 1.0 | 1.0000000 | 0.85 |
Fish | Spawning Timing | Measurable | SourceDat | 1.0 | 1.0000000 | 0.85 |
Fish | Spawning Timing | Measurable | SourceAvail | 1.0 | 1.0000000 | 0.85 |
Fish | Spawning Timing | Measurable | SourceContact | 1.0 | 1.0000000 | 0.85 |
Fish | Spawning Timing | Achievable | Tested | 1.0 | 0.6666667 | 0.85 |
Fish | Spawning Timing | Achievable | Sensitivity | 1.0 | 0.6666667 | 0.85 |
Fish | Spawning Timing | Achievable | TimeLag | 0.0 | 0.6666667 | 0.85 |
Fish | Spawning Timing | Relevant | Advice | 1.0 | 1.0000000 | 0.85 |
Fish | Spawning Timing | Relevant | Implications | 1.0 | 1.0000000 | 0.85 |
Fish | Spawning Timing | Relevant | TargThresh | 1.0 | 1.0000000 | 0.85 |
Fish | Spawning Timing | Timebound | Frequency | 1.0 | 0.7500000 | 0.85 |
Fish | Spawning Timing | Timebound | Updated | 0.5 | 0.7500000 | 0.85 |
3.1 Comments
[Fill below by hand once above data complete]
3.1.1 Additional potential links to management in addition to uses listed above
3.1.2 What additional work would be needed for the Council to use the indicator?
3.1.3 What issues are caused if there is a gap or delay in data underlying the indicator