SMART Indicator Report: Southern Oscillation Index
1 Descriptive Section
1.3 Indicator brief description
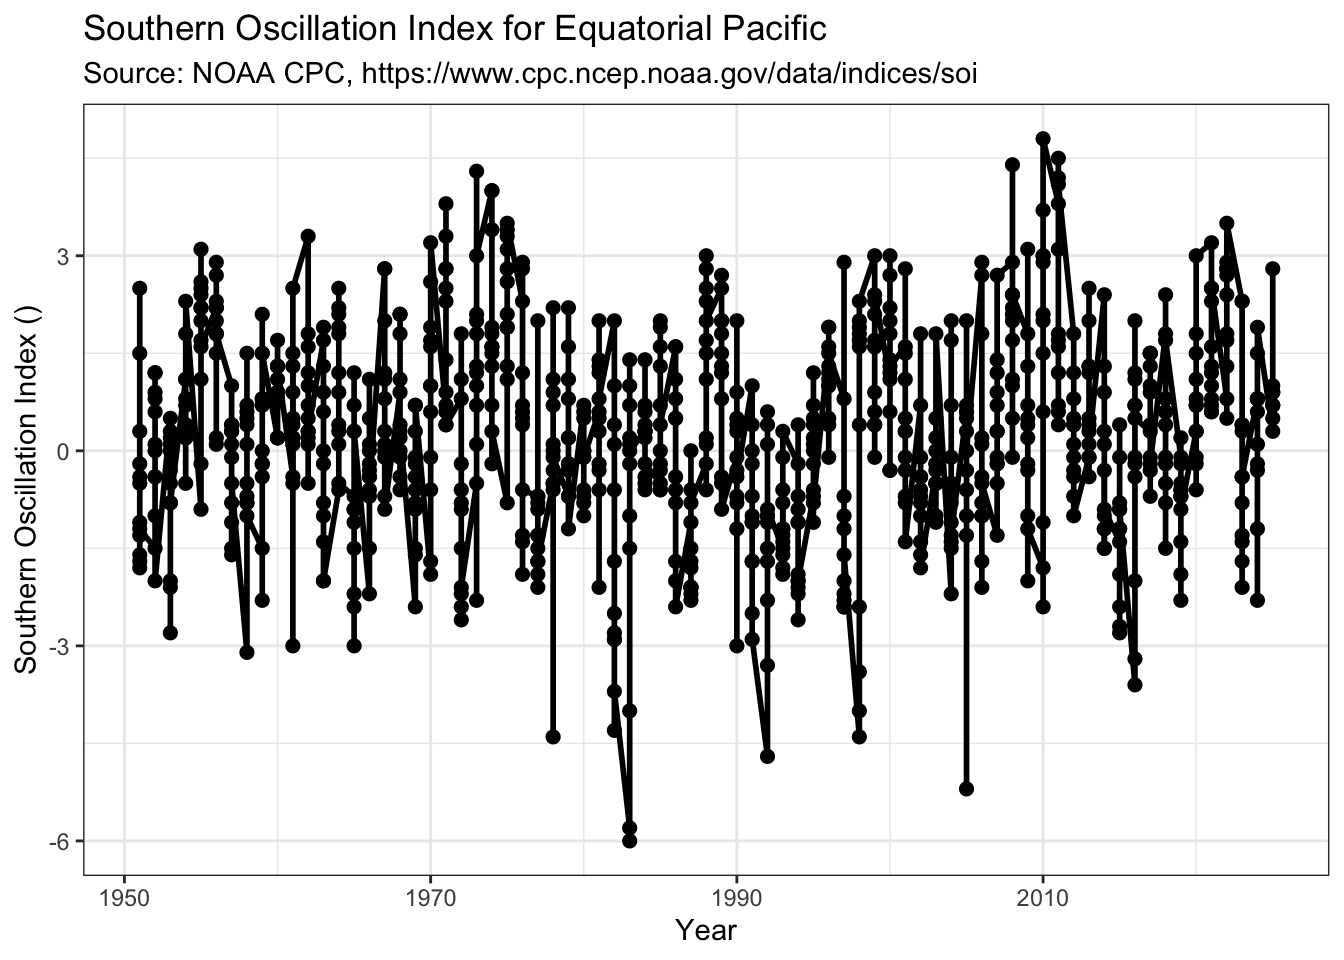
The Southern Oscillation Index (SOI) measures differences over time in sea level air pressure between the central (Tahiti) and western (Darwin, Australia) tropical Pacific.
1.4 Indicator visualization
The SOI oscillates between negative (pressure higher at Darwin Australia, often associated with warmer ocean water El Niño conditions) and positive (pressure higher over Tahiti, often associated with cooler ocean water La Niña conditions) phases every 2-7 years, and was in a positive phase as of late 2025.
2 SMART Attribute Section
2.1 Indicator documentation
2.1.1 Are indicators available for others to use (data downloadable)?
Yes
2.1.1.1 Where can indicators be found?
All marea indicators are here: https://github.com/MarEcosystemApproaches/marea
2.1.1.3 Who is the contact?
Jamie C. Tam jamie.tam@dfo-mpo.gc.ca
2.1.2 Gather indicator statistics
2.1.2.2 Length of time series, start and end date, periodicity
General overview: Annual and Monthly
Indicator specifics:
Indicator | EPU | StartYear | EndYear |
|---|---|---|---|
Southern Oscillation Index | Equatorial Pacific | 1951 | 2025 |
2.1.2.3 Spatial location, scale and extent
General overview: Tahiti-Darwin (SLP diff)
Indicator specifics:
Indicator | EPU |
|---|---|
Southern Oscillation Index | Equatorial Pacific |
2.1.3 Are methods clearly documented to obtain source data and calculate indicators?
No methods documentation is provided
2.1.3.1 Can the indicator be calculated from current documentation?
No. No methods documentation is provided
2.1.3.3 Have methods changed over time?
Some changes over time are documented here: https://www.cpc.ncep.noaa.gov/data/indices/Readme.index.shtml
2.1.4 Are indicator underlying source data linked or easy to find?
Yes. Source information included: NOAA CPC, https://www.cpc.ncep.noaa.gov/data/indices/soi
2.1.4.1 Where are source data stored?
Source data stored at NOAA CPC, https://www.cpc.ncep.noaa.gov/data/indices/soi
2.1.4.2 How/by whom are source data updated? Are future updates likely?
No. No source data steward information
2.1.4.3 How often are they updated?
Monthly (https://www.cpc.ncep.noaa.gov/data/indices/Readme.index.shtml ) Current data lag by 1 month from present.
2.2 Indicator analysis/testing or history of use
2.2.1 What decision or advice processes are the indicators currently used in?
None known in the Mid-Atlantic.
2.2.2 What implications of the indicators are currently listed?
This is one indicator of the El Niño/Southern Oscillation (ENSO) pattern that affects atmospheric patterns and weather conditions globally. To declare El Niño or La Niña conditions, the SIO and ENSO sea surface temperature indicators need to be synchronized. See https://www.climate.gov/news-features/understanding-climate/climate-variability-southern-oscillation-index. Different regions can experience unusual flooding or droughts as a result of the ENSO conditions and their effects on winds, upwelling, water temperature, and changes in atmospheric pressure affecting precipitation. While drought or flooding could occur anytime, regional events may be more predictable during one phase or the other of SIO and ENSO. See https://www.ncei.noaa.gov/access/monitoring/enso/ and https://iri.columbia.edu/our-expertise/climate/enso/why-do-we-care-about-el-nino-and-la-nina/
2.2.3 Do target, limit, or threshold values already exist for the indicator?
Yes, criteria for this indicator (in combination with ENSO sea surface temperature indicators) are established to establish the current phase of ENSO conditions.
2.2.4 Have the indicators been tested to ensure they respond proportionally to a change in the underlying process?
Yes, but generally other ENSO indicators are compared against the SOI for predicting El Niño, La Niña, or neutral conditions. See https://journals.ametsoc.org/view/journals/clim/16/8/1520-0442_2003_16_1249_aqeoei_2.0.co_2.xml
3 SMART rating
Category | Indicator | Element | Attribute | Rating | ElementRating | OverallRating |
|---|---|---|---|---|---|---|
Habitat-Physical | Southern Oscillation Index | Specific | Described | 1 | 0.3333333 | 0.6333333 |
Habitat-Physical | Southern Oscillation Index | Specific | Units | 0 | 0.3333333 | 0.6333333 |
Habitat-Physical | Southern Oscillation Index | Specific | Spatial | 1 | 0.3333333 | 0.6333333 |
Habitat-Physical | Southern Oscillation Index | Specific | Uncertainty | 0 | 0.3333333 | 0.6333333 |
Habitat-Physical | Southern Oscillation Index | Specific | Methods | 0 | 0.3333333 | 0.6333333 |
Habitat-Physical | Southern Oscillation Index | Specific | Code | 0 | 0.3333333 | 0.6333333 |
Habitat-Physical | Southern Oscillation Index | Measurable | Available | 1 | 0.8333333 | 0.6333333 |
Habitat-Physical | Southern Oscillation Index | Measurable | Online | 1 | 0.8333333 | 0.6333333 |
Habitat-Physical | Southern Oscillation Index | Measurable | Contact | 1 | 0.8333333 | 0.6333333 |
Habitat-Physical | Southern Oscillation Index | Measurable | SourceDat | 1 | 0.8333333 | 0.6333333 |
Habitat-Physical | Southern Oscillation Index | Measurable | SourceAvail | 1 | 0.8333333 | 0.6333333 |
Habitat-Physical | Southern Oscillation Index | Measurable | SourceContact | 0 | 0.8333333 | 0.6333333 |
Habitat-Physical | Southern Oscillation Index | Achievable | Tested | 1 | 0.3333333 | 0.6333333 |
Habitat-Physical | Southern Oscillation Index | Achievable | Sensitivity | 0 | 0.3333333 | 0.6333333 |
Habitat-Physical | Southern Oscillation Index | Achievable | TimeLag | 0 | 0.3333333 | 0.6333333 |
Habitat-Physical | Southern Oscillation Index | Relevant | Advice | 0 | 0.6666667 | 0.6333333 |
Habitat-Physical | Southern Oscillation Index | Relevant | Implications | 1 | 0.6666667 | 0.6333333 |
Habitat-Physical | Southern Oscillation Index | Relevant | TargThresh | 1 | 0.6666667 | 0.6333333 |
Habitat-Physical | Southern Oscillation Index | Timebound | Frequency | 1 | 1.0000000 | 0.6333333 |
Habitat-Physical | Southern Oscillation Index | Timebound | Updated | 1 | 1.0000000 | 0.6333333 |
3.1 Comments
3.1.1 Additional potential links to management in addition to uses listed above
[Select from list of management processes/actions using exact keywords]
3.1.2 What additional work would be needed for the Council to use the indicator?
[List current gaps in the indicator given the current or potentail uses listed above, what resources are needed?]
3.1.3 What issues are caused if there is a gap or delay in data underlying the indicator
[Link to management process/actions and their requirements]