SMART Indicator Report: Slopewater Proportions
1 Descriptive Section
1.2 Indicator name
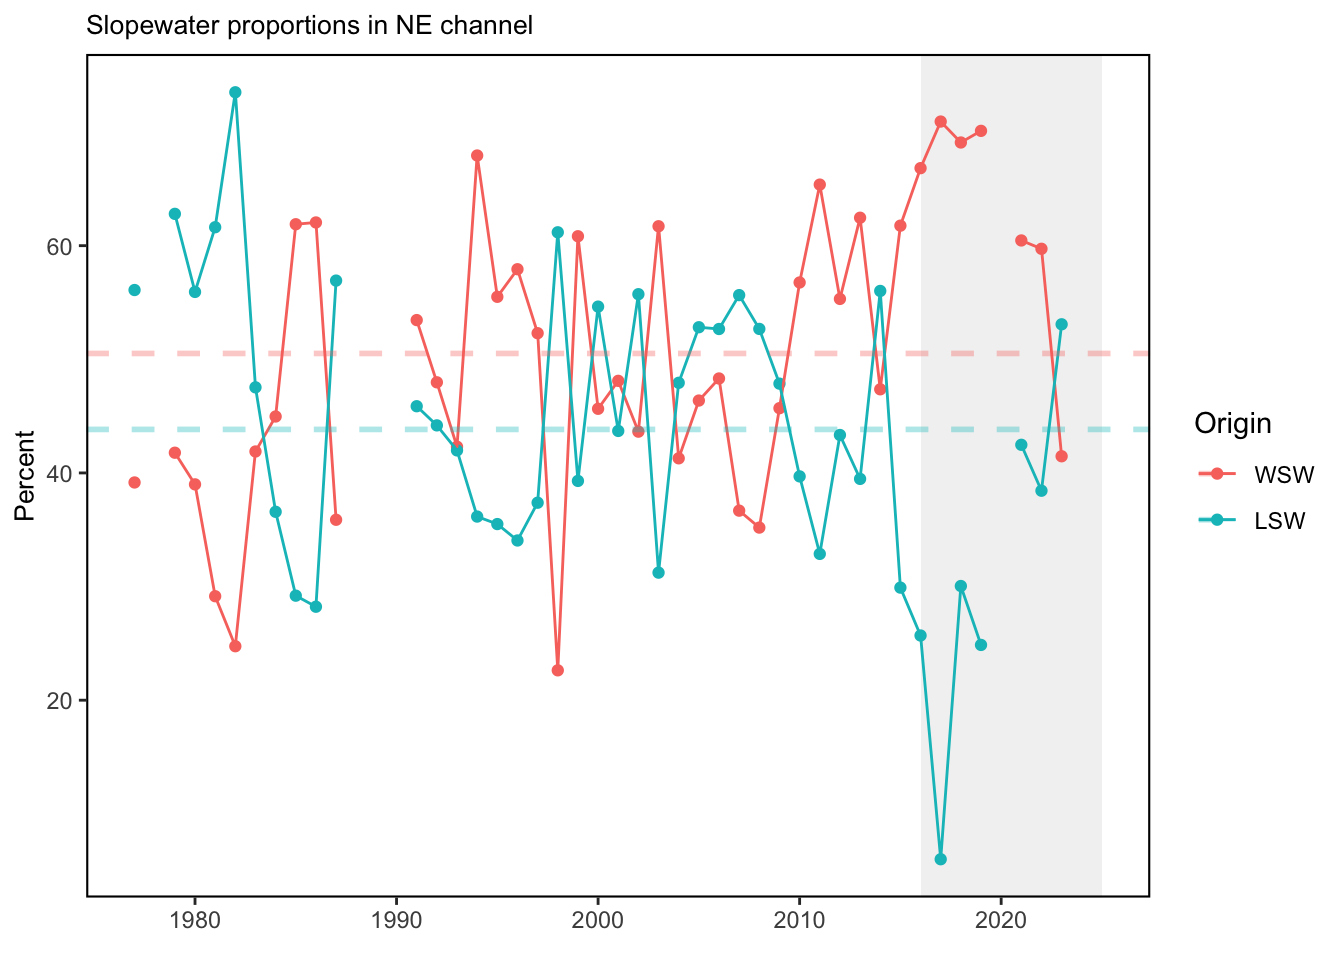
Slopewater Proportions
Includes variable(s): LSLW proportion ne channel, WSW proportion ne channel
2 SMART Attribute Section
2.1 Indicator documentation
2.1.1 Are indicators available for others to use (data downloadable)?
Yes
2.1.1.1 Where can indicators be found?
Data: https://noaa-edab.github.io/ecodata/index.html
Description: https://noaa-edab.github.io/catalog/slopewater.html
Technical documentation: https://noaa-edab.github.io/tech-doc/slopewater.html
2.1.1.2 How often are they updated? Are future updates likely?
[need sequential look at datasets for update frequency. Future requires judgement]
2.1.1.3 Who is the contact?
Paula Fratantoni (paula.fratantoni@noaa.gov)
2.1.2 Gather indicator statistics
2.1.2.2 Length of time series, start and end date, periodicity
General overview: Annual
Indicator specifics:
Indicator | EPU | StartYear | EndYear | NumYears | MissingYears |
|---|---|---|---|---|---|
LSLW proportion ne channel | GOM | 1964 | 2023 | 52 | 8 |
WSW proportion ne channel | GOM | 1964 | 2023 | 52 | 8 |
2.1.2.3 Spatial location, scale and extent
General overview: Within the central Northeast Channel
Indicator specifics:
Indicator | EPU |
|---|---|
LSLW proportion ne channel | GOM |
WSW proportion ne channel | GOM |
2.1.3 Are methods clearly documented to obtain source data and calculate indicators?
Yes
2.1.3.1 Can the indicator be calculated from current documentation?
While all processed hydrographic data are archived in an Oracle database (OCDBS), we work from Matlab-formatted files stored locally.
Temperature and salinity measurements are examined to assess the composition of the waters entering the Gulf of Maine through the Northeast Channel. The analysis closely follows the methodology described by Mountain (2012). This method assumes that the waters flowing into the Northeast Channel between 150 and 200 meters depth are composed of slope waters, originating offshore of the continental shelf, and shelf waters, originating on the continental shelf south of Nova Scotia. For each survey in the hydrographic archive, ocean temperature and salinity observations sampled in the area just inside the Northeast Channel (bounded by 42.2-42.6° latitude north and 66-66.8° longitude west) and between 150 - 200 meters depth are extracted and a volume-weighted average temperature and salinity is calculated. The volume weighting is accomplished by apportioning the area within the Northeast Channel polygon among the stations occupying the region, based on inverse distance squared weighting. The result of this calculation is a timeseries of volume-average temperature and salinity having a temporal resolution that matches the survey frequency in the database. The average temperature and salinity observed at depth in the Northeast Channel is assumed to be the product of mixing between three distinct sources having the following temperature and salinity characteristics: (1) Warm Slope Water (T=12 °C, S=35.5), (2) Labrador Slope Water (T=6 °C, S=34.6) and (3) Scotian Shelf Water (T=2 °C, S=32). As described by Mountain (2012), the relative proportion of each source is determined via a rudimentary 3-point mixing algorithm. On a temperature-salinity diagram, lines connecting the T-S coordinates for these three sources form a triangle, the sides of which represent mixing lines between the sources. A water sample that is a mixture of two sources will have a temperature and salinity that falls somewhere along the line connecting the two sources on the temperature-salinity diagram. Observations of temperature and salinity collected within the Northeast Channel would be expected to fall within the triangle if the water sampled is a mixture of the three sources. Simple geometry allows us to calculate the relative proportion of each source in a given measurement. As an example, a line drawn from the T-S point representing shelf water through an observed T-S in the center of the triangle will intersect the opposite side of the triangle (the mixing line connecting the coordinates of the two slope water sources). This intersecting T-S value may then be used to calculate the relative proportions (percentage) of the two slope water sources. Using this method, the percentage of Labrador slope water and Warm slope water are determined for the timeseries of volume-average temperature and salinity. It should be noted that our method assumes that the temperature and salinity properties associated with the source watermasses are constant. In reality, these may vary from year to year, modified by atmospheric forcing, mixing and/or advective processes. Likewise, other sources are periodically introduced into the Northeast Channel, including intrusions of Gulf Stream water flowing into the Gulf of Maine and modified shelf water flowing out of the Gulf of Maine along the flank of Georges Bank. These sources are not explicitly considered in the 3-point mixing algorithm and may introduce errors in the proportional estimates.
2.1.4 Are indicator underlying source data linked or easy to find?
Source data are publicly available at ftp://ftp.nefsc.noaa.gov/pub/hydro/matlab_files/yearly and in the World Ocean Database housed at http://www.nodc.noaa.gov/OC5/SELECT/dbsearch/dbsearch.html under institute code 258
2.1.4.1 Where are source data stored?
The slope water composition index incorporates temperature and salinity measurements collected on Northeast Fisheries Science Center surveys between 1977-present within the geographic confines of the Northeast Channel in the Gulf of Maine. Early measurements were made using water samples collected primarily with Niskin bottles at discreet depths, mechanical bathythermographs and expendable bathythermograph probes, but by 1991 the CTD – an acronym for conductivity temperature and depth – became standard equipment on all NEFSC surveys. Source data are publicly available at https://comet.nefsc.noaa.gov/erddap/tabledap/ocdbs_v_erddap1.html
2.1.4.2 How/by whom are source data updated? Are future updates likely?
Kimberly Bastille, kimberly.bastille@noaa.gov
[likelihood of source data updates requires judgement, enter by hand]
2.2 Indicator analysis/testing or history of use
2.2.1 What decision or advice processes are the indicators currently used in?
Temperature and salinity measurements are examined to assess the composition of the waters entering the Gulf of Maine through the deep Northeast Channel. The analysis closely follows the methodology described by [90]. This method assumes that the waters flowing into the Northeast Channel between 150 and 200 meters depth are composed of slope waters, originating offshore of the continental shelf, and shelf waters, originating on the continental shelf south of Nova Scotia.
2.2.4 Have the indicators been tested to ensure they respond proportionally to a change in the underlying process?
No
3 SMART rating
Category | Indicator | Element | Attribute | Rating | ElementRating | OverallRating |
|---|---|---|---|---|---|---|
Habitat-Physical | Slopewater Proportions | Specific | Described | 1.0 | 0.6666667 | 0.6166667 |
Habitat-Physical | Slopewater Proportions | Specific | Units | 1.0 | 0.6666667 | 0.6166667 |
Habitat-Physical | Slopewater Proportions | Specific | Spatial | 1.0 | 0.6666667 | 0.6166667 |
Habitat-Physical | Slopewater Proportions | Specific | Uncertainty | 0.0 | 0.6666667 | 0.6166667 |
Habitat-Physical | Slopewater Proportions | Specific | Methods | 1.0 | 0.6666667 | 0.6166667 |
Habitat-Physical | Slopewater Proportions | Specific | Code | 0.0 | 0.6666667 | 0.6166667 |
Habitat-Physical | Slopewater Proportions | Measurable | Available | 1.0 | 1.0000000 | 0.6166667 |
Habitat-Physical | Slopewater Proportions | Measurable | Online | 1.0 | 1.0000000 | 0.6166667 |
Habitat-Physical | Slopewater Proportions | Measurable | Contact | 1.0 | 1.0000000 | 0.6166667 |
Habitat-Physical | Slopewater Proportions | Measurable | SourceDat | 1.0 | 1.0000000 | 0.6166667 |
Habitat-Physical | Slopewater Proportions | Measurable | SourceAvail | 1.0 | 1.0000000 | 0.6166667 |
Habitat-Physical | Slopewater Proportions | Measurable | SourceContact | 1.0 | 1.0000000 | 0.6166667 |
Habitat-Physical | Slopewater Proportions | Achievable | Tested | 0.0 | 0.0000000 | 0.6166667 |
Habitat-Physical | Slopewater Proportions | Achievable | Sensitivity | 0.0 | 0.0000000 | 0.6166667 |
Habitat-Physical | Slopewater Proportions | Achievable | TimeLag | 0.0 | 0.0000000 | 0.6166667 |
Habitat-Physical | Slopewater Proportions | Relevant | Advice | 1.0 | 0.6666667 | 0.6166667 |
Habitat-Physical | Slopewater Proportions | Relevant | Implications | 1.0 | 0.6666667 | 0.6166667 |
Habitat-Physical | Slopewater Proportions | Relevant | TargThresh | 0.0 | 0.6666667 | 0.6166667 |
Habitat-Physical | Slopewater Proportions | Timebound | Frequency | 1.0 | 0.7500000 | 0.6166667 |
Habitat-Physical | Slopewater Proportions | Timebound | Updated | 0.5 | 0.7500000 | 0.6166667 |
3.1 Comments
[Fill below by hand once above data complete]
3.1.1 Additional potential links to management in addition to uses listed above
3.1.2 What additional work would be needed for the Council to use the indicator?
3.1.3 What issues are caused if there is a gap or delay in data underlying the indicator