SMART Indicator Report: Seasonal OISST Anomaly Map
2 SMART Attribute Section
2.1 Indicator documentation
2.1.1 Are indicators available for others to use (data downloadable)?
Yes
2.1.1.1 Where can indicators be found?
Data: https://noaa-edab.github.io/ecodata/index.html
Description: https://noaa-edab.github.io/catalog/seasonal_oisst_anom_gridded.html
Technical documentation: https://noaa-edab.github.io/tech-doc/seasonal_oisst_anom_gridded.html
2.1.1.2 How often are they updated? Are future updates likely?
[need sequential look at datasets for update frequency. Future requires judgement]
2.1.2 Gather indicator statistics
2.1.2.2 Length of time series, start and end date, periodicity
General overview: Seasonal: Winter (January - March), Spring (April - June), Summer (July - September), Fall (October - December)
Indicator specifics:
Indicator | Varname |
|---|---|
no Var field | no Time Variables |
2.1.2.3 Spatial location, scale and extent
General overview: EPUs on full shelf map
Indicator specifics:
Indicator | EPU |
|---|---|
no Var field | no EPU field |
2.1.3 Are methods clearly documented to obtain source data and calculate indicators?
Yes
2.1.3.1 Can the indicator be calculated from current documentation?
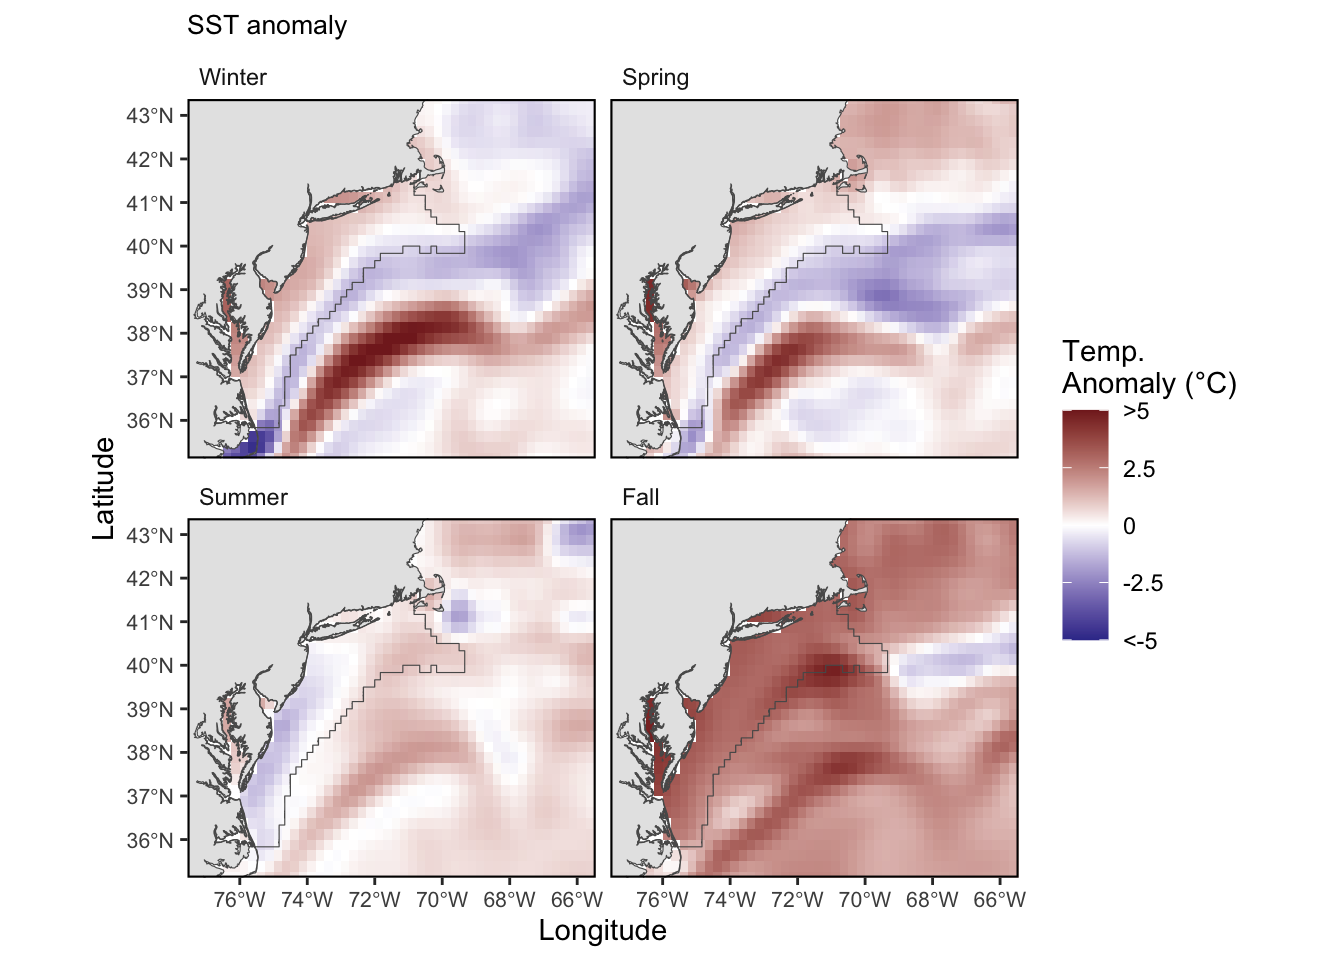
Individual files containing daily mean SST data for each year during the period of 1981-present were downloaded from the OI SST V5 site. Yearly data provided as layered rasters were masked according to the extent of Northeast US Continental Shelf. Data were split into three month seasons for (Winter = Jan, Feb, Mar; Spring = Apr, May, Jun; Summer = July, August, September; Fall = Oct, Nov, Dec). This is done in a GitHub action and is available online in ecopull.
We calculated the long-term mean (LTM) for each season-specific stack of rasters over the period of 1982-2010, and then subtracted the (LTM) from daily mean SST values to find the SST anomaly for a given year. The use of climatological reference periods is a standard procedure for the calculation of meteorological anomalies (WMO 2017). Prior to 2019 State of the Ecosystem reports, SST anomaly information made use of a 1982-2012 reference period. A 1982-2010 reference period was adopted to facilitate calculating anomalies from a standard NOAA ESRL data set.
2.1.4 Are indicator underlying source data linked or easy to find?
Source data are available here.
2.1.4.1 Where are source data stored?
Data for seasonal sea surface tempature anomalies were derived from the National Oceanographic and Atmospheric Administartion optimum interpolation sea surface temperature high resolution data set (NOAA OISST V2) provided by NOAA Earth System Research Laboratory’s Physical Science Division, Boulder, CO. The data extend from 1981 to present, and provide a 0.25° x 0.25° global grid of SST measurements (Reynolds et al. 2007). In 2021, the Daily OISST data was updated and there are a couple papers describing and comparing the new version Huang, Liu, Banzon, et al. (2021).
2.1.4.2 How/by whom are source data updated? Are future updates likely?
Brandon Beltz, Brandon.Beltz@noaa.gov
[likelihood of source data updates requires judgement, enter by hand]
2.2 Indicator analysis/testing or history of use
2.2.1 What decision or advice processes are the indicators currently used in?
Data for sea surface anomalies were derived from the National Oceanographic and Atmospheric Administration optimum interpolation sea surface temperature high resolution data set (NOAA OISST V2). Mean seasonal-annual SST was calculated for each EPU. To These data extend from 1981 to present. Anomalies are calculate by subtracting the long-term mean temperature is calculated from 1982-2010 for each season, from the seasonal-annual mean SST. Gridded anomalies are presented on a map for each year.
2.2.2 What implications of the indicators are currently listed?
Sea surface temperature is an indicator of thermal habitat for pelagic species. Long-term warming trends suggest wide-spread environmental change in the system. Warming trends can have potential impacts on species spatial distributions, the seasonal timing of species life history events, and the overall productivity of the system. Maps show how temperature change has been distributed in each EPU each year.
2.2.4 Have the indicators been tested to ensure they respond proportionally to a change in the underlying process?
No
3 SMART rating
Category | Indicator | Element | Attribute | Rating | ElementRating | OverallRating |
|---|---|---|---|---|---|---|
Habitat-Physical | Seasonal OISST Anomaly Map | Specific | Described | 1 | 0.5000000 | 0.5333333 |
Habitat-Physical | Seasonal OISST Anomaly Map | Specific | Units | 0 | 0.5000000 | 0.5333333 |
Habitat-Physical | Seasonal OISST Anomaly Map | Specific | Spatial | 1 | 0.5000000 | 0.5333333 |
Habitat-Physical | Seasonal OISST Anomaly Map | Specific | Uncertainty | 0 | 0.5000000 | 0.5333333 |
Habitat-Physical | Seasonal OISST Anomaly Map | Specific | Methods | 1 | 0.5000000 | 0.5333333 |
Habitat-Physical | Seasonal OISST Anomaly Map | Specific | Code | 0 | 0.5000000 | 0.5333333 |
Habitat-Physical | Seasonal OISST Anomaly Map | Measurable | Available | 1 | 1.0000000 | 0.5333333 |
Habitat-Physical | Seasonal OISST Anomaly Map | Measurable | Online | 1 | 1.0000000 | 0.5333333 |
Habitat-Physical | Seasonal OISST Anomaly Map | Measurable | Contact | 1 | 1.0000000 | 0.5333333 |
Habitat-Physical | Seasonal OISST Anomaly Map | Measurable | SourceDat | 1 | 1.0000000 | 0.5333333 |
Habitat-Physical | Seasonal OISST Anomaly Map | Measurable | SourceAvail | 1 | 1.0000000 | 0.5333333 |
Habitat-Physical | Seasonal OISST Anomaly Map | Measurable | SourceContact | 1 | 1.0000000 | 0.5333333 |
Habitat-Physical | Seasonal OISST Anomaly Map | Achievable | Tested | 0 | 0.0000000 | 0.5333333 |
Habitat-Physical | Seasonal OISST Anomaly Map | Achievable | Sensitivity | 0 | 0.0000000 | 0.5333333 |
Habitat-Physical | Seasonal OISST Anomaly Map | Achievable | TimeLag | 0 | 0.0000000 | 0.5333333 |
Habitat-Physical | Seasonal OISST Anomaly Map | Relevant | Advice | 1 | 0.6666667 | 0.5333333 |
Habitat-Physical | Seasonal OISST Anomaly Map | Relevant | Implications | 1 | 0.6666667 | 0.5333333 |
Habitat-Physical | Seasonal OISST Anomaly Map | Relevant | TargThresh | 0 | 0.6666667 | 0.5333333 |
Habitat-Physical | Seasonal OISST Anomaly Map | Timebound | Frequency | 1 | 0.5000000 | 0.5333333 |
Habitat-Physical | Seasonal OISST Anomaly Map | Timebound | Updated | 0 | 0.5000000 | 0.5333333 |
3.1 Comments
[Fill below by hand once above data complete]
3.1.1 Additional potential links to management in addition to uses listed above
3.1.2 What additional work would be needed for the Council to use the indicator?
3.1.3 What issues are caused if there is a gap or delay in data underlying the indicator