SMART Indicator Report: Sea-surface temperature anomaly
1 Descriptive Section
1.2 Indicator name
Sea-surface temperature anomaly
Includes variable(s): Fall, Spring, Summer, Winter
1.4 Indicator visualization
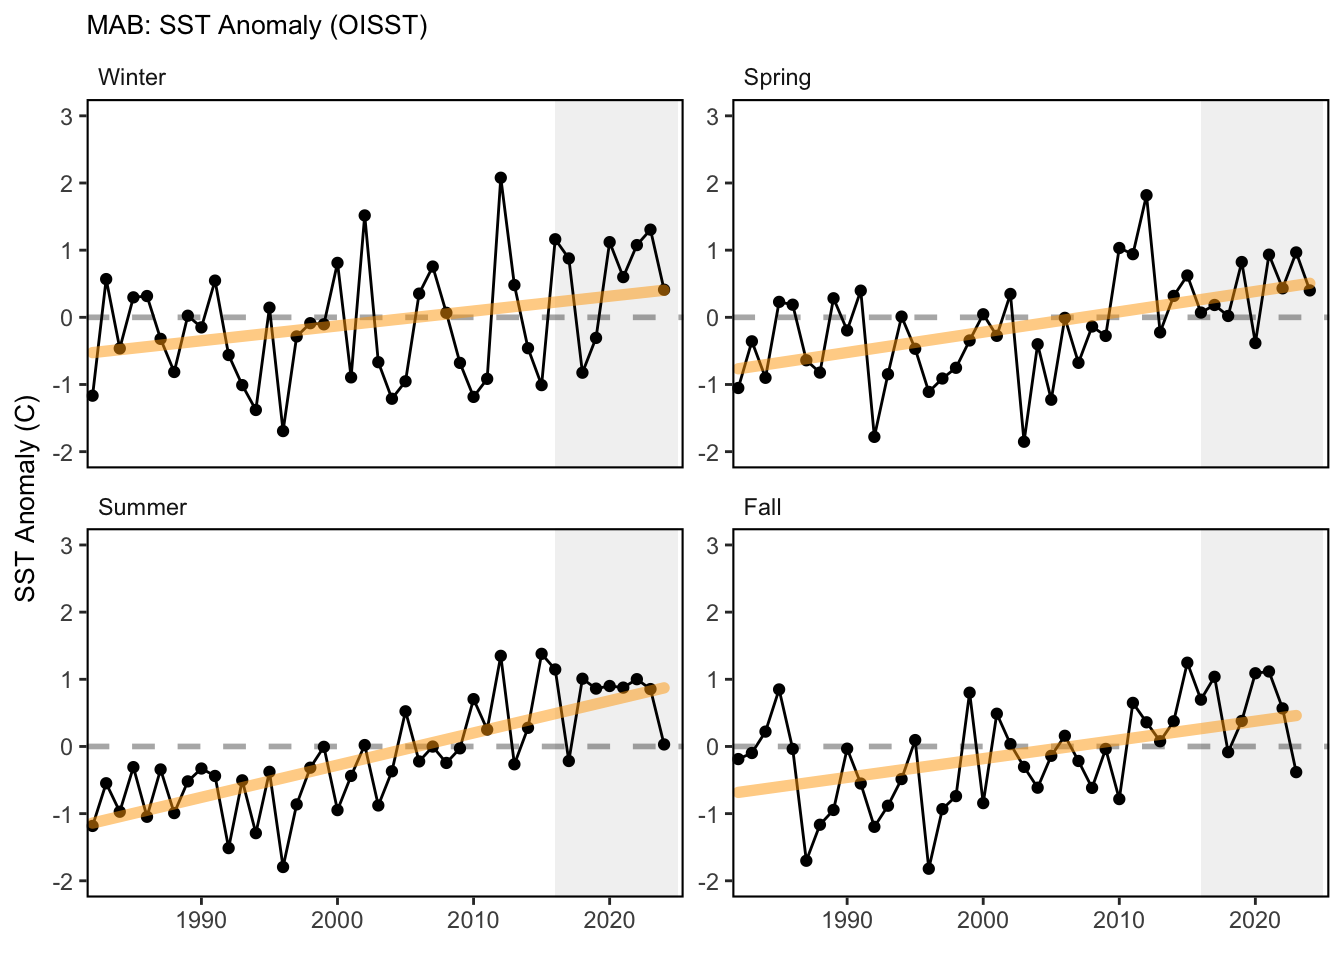
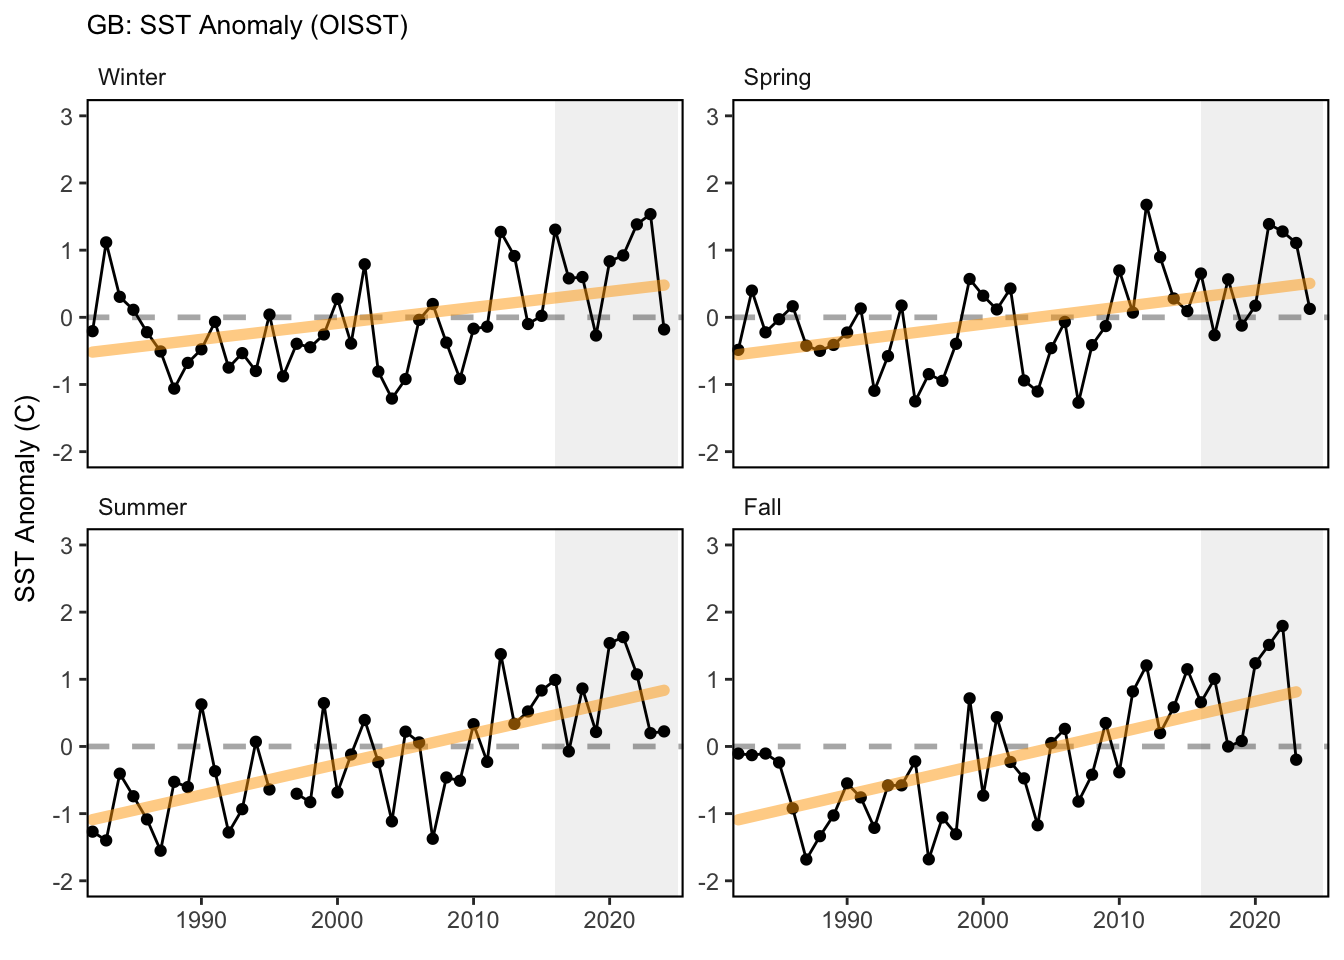
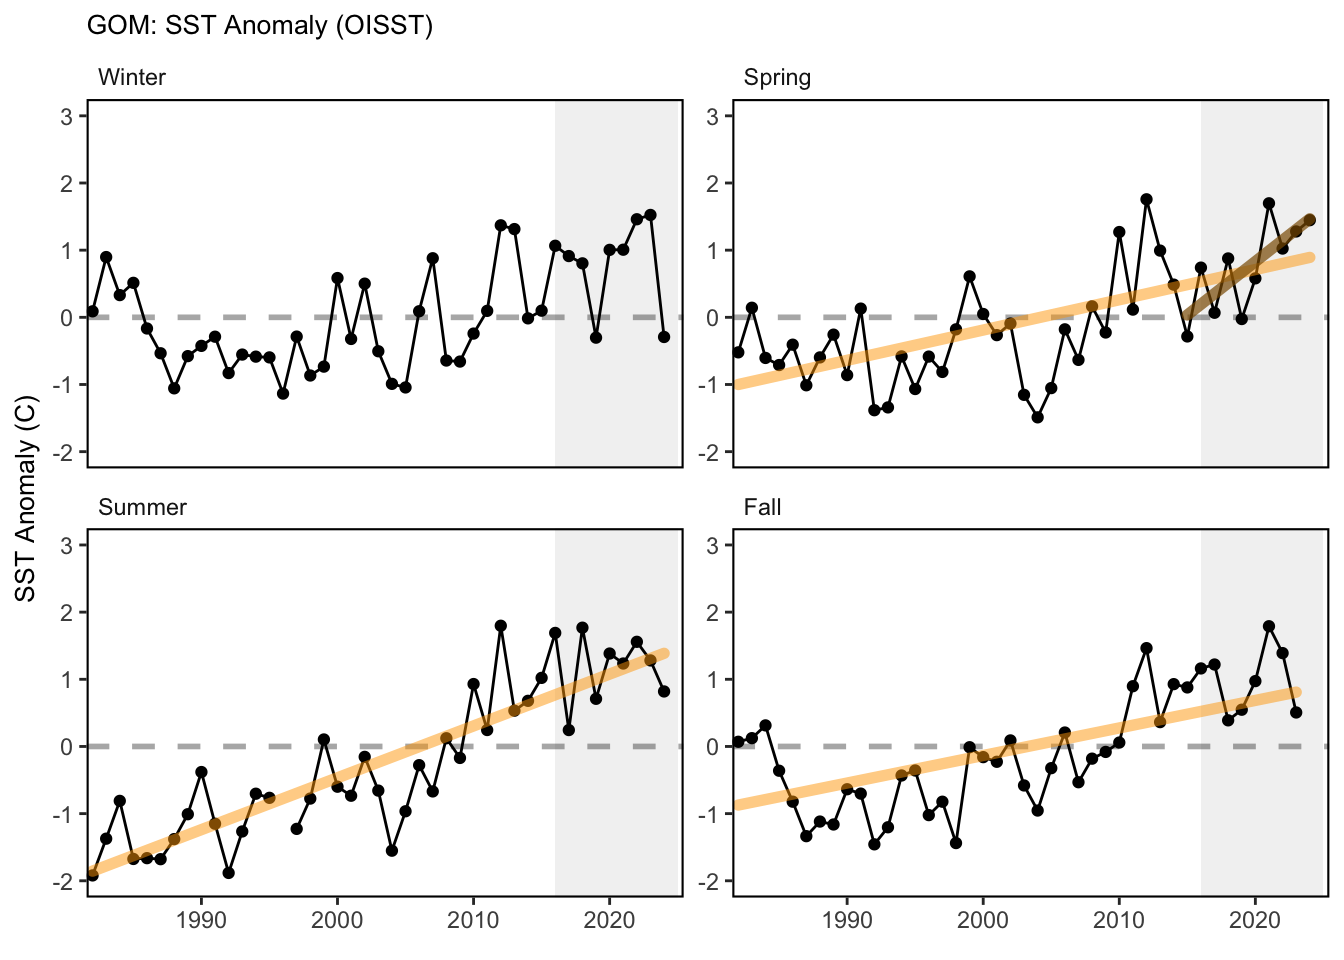
Since 1982, SST has been increasing in all seasons in all three EPUs. 2023 was the warmest winter SST in the GOM and GB on record. All record warmest seasonal SST years have occurred on or after 2012. 2023 also saw relatively cooler summer temperatures in GB and the GOM and fall temperatures in all regions.
2 SMART Attribute Section
2.1 Indicator documentation
2.1.1 Are indicators available for others to use (data downloadable)?
Yes
2.1.1.1 Where can indicators be found?
Data: https://noaa-edab.github.io/ecodata/index.html
Description: https://noaa-edab.github.io/catalog/seasonal_oisst_anom.html
Technical documentation: https://noaa-edab.github.io/tech-doc/seasonal_oisst_anom.html
2.1.1.2 How often are they updated? Are future updates likely?
[need sequential look at datasets for update frequency. Future requires judgement]
2.1.2 Gather indicator statistics
2.1.2.1 Units
Indicator | Units |
|---|---|
Fall | no Units field |
Spring | no Units field |
Summer | no Units field |
Winter | no Units field |
2.1.2.2 Length of time series, start and end date, periodicity
General overview: Seasonal: Winter (January - March), Spring (April - June), Summer (July - September), Fall (October - December)
Indicator specifics:
Indicator | EPU | StartYear | EndYear | NumYears | MissingYears |
|---|---|---|---|---|---|
Fall | GB | 1982 | 2023 | 42 | 0 |
Fall | GOM | 1982 | 2023 | 42 | 0 |
Fall | MAB | 1982 | 2023 | 42 | 0 |
Spring | GB | 1982 | 2024 | 43 | 0 |
Spring | GOM | 1982 | 2024 | 43 | 0 |
Spring | MAB | 1982 | 2024 | 43 | 0 |
Summer | GB | 1982 | 2024 | 43 | 0 |
Summer | GOM | 1982 | 2024 | 43 | 0 |
Summer | MAB | 1982 | 2024 | 43 | 0 |
Winter | GB | 1982 | 2024 | 43 | 0 |
Winter | GOM | 1982 | 2024 | 43 | 0 |
Winter | MAB | 1982 | 2024 | 43 | 0 |
2.1.2.3 Spatial location, scale and extent
General overview: EPU
Indicator specifics:
Indicator | EPU |
|---|---|
Fall | GB |
Fall | GOM |
Fall | MAB |
Spring | GB |
Spring | GOM |
Spring | MAB |
Summer | GB |
Summer | GOM |
Summer | MAB |
Winter | GB |
Winter | GOM |
Winter | MAB |
2.2 Indicator analysis/testing or history of use
2.2.1 What decision or advice processes are the indicators currently used in?
Sea surface temperature can be used as a proxy for overall thermal conditions in the system. Data for sea surface anomalies were derived from the National Oceanographic and Atmospheric Administration optimum interpolation sea surface temperature high resolution data set (NOAA OISST V2). Mean seasonal-annual SST was calculated for each EPU. These data extend from 1981 to present. Anomalies are calculated by subtracting the long-term mean temperature from 1990-2010 for each season, from the seasonal-annual mean SST.
2.2.2 What implications of the indicators are currently listed?
Sea surface temperature is an indicator of thermal habitat for pelagic species. Long-term warming trends suggest wide-spread environmental change in the system. Warming trends can have potential impacts on species spatial distributions, the seasonal timing of species life history events, and the overall productivity of the system.
2.2.4 Have the indicators been tested to ensure they respond proportionally to a change in the underlying process?
No
3 SMART rating
Category | Indicator | Element | Attribute | Rating | ElementRating | OverallRating |
|---|---|---|---|---|---|---|
Habitat-Physical | Sea-surface temperature anomaly | Specific | Described | 1 | 0.5000000 | 0.5333333 |
Habitat-Physical | Sea-surface temperature anomaly | Specific | Units | 0 | 0.5000000 | 0.5333333 |
Habitat-Physical | Sea-surface temperature anomaly | Specific | Spatial | 1 | 0.5000000 | 0.5333333 |
Habitat-Physical | Sea-surface temperature anomaly | Specific | Uncertainty | 0 | 0.5000000 | 0.5333333 |
Habitat-Physical | Sea-surface temperature anomaly | Specific | Methods | 1 | 0.5000000 | 0.5333333 |
Habitat-Physical | Sea-surface temperature anomaly | Specific | Code | 0 | 0.5000000 | 0.5333333 |
Habitat-Physical | Sea-surface temperature anomaly | Measurable | Available | 1 | 0.5000000 | 0.5333333 |
Habitat-Physical | Sea-surface temperature anomaly | Measurable | Online | 1 | 0.5000000 | 0.5333333 |
Habitat-Physical | Sea-surface temperature anomaly | Measurable | Contact | 1 | 0.5000000 | 0.5333333 |
Habitat-Physical | Sea-surface temperature anomaly | Measurable | SourceDat | 0 | 0.5000000 | 0.5333333 |
Habitat-Physical | Sea-surface temperature anomaly | Measurable | SourceAvail | 0 | 0.5000000 | 0.5333333 |
Habitat-Physical | Sea-surface temperature anomaly | Measurable | SourceContact | 0 | 0.5000000 | 0.5333333 |
Habitat-Physical | Sea-surface temperature anomaly | Achievable | Tested | 0 | 0.0000000 | 0.5333333 |
Habitat-Physical | Sea-surface temperature anomaly | Achievable | Sensitivity | 0 | 0.0000000 | 0.5333333 |
Habitat-Physical | Sea-surface temperature anomaly | Achievable | TimeLag | 0 | 0.0000000 | 0.5333333 |
Habitat-Physical | Sea-surface temperature anomaly | Relevant | Advice | 1 | 0.6666667 | 0.5333333 |
Habitat-Physical | Sea-surface temperature anomaly | Relevant | Implications | 1 | 0.6666667 | 0.5333333 |
Habitat-Physical | Sea-surface temperature anomaly | Relevant | TargThresh | 0 | 0.6666667 | 0.5333333 |
Habitat-Physical | Sea-surface temperature anomaly | Timebound | Frequency | 1 | 1.0000000 | 0.5333333 |
Habitat-Physical | Sea-surface temperature anomaly | Timebound | Updated | 1 | 1.0000000 | 0.5333333 |
3.1 Comments
[Fill below by hand once above data complete]
3.1.1 Additional potential links to management in addition to uses listed above
3.1.2 What additional work would be needed for the Council to use the indicator?
3.1.3 What issues are caused if there is a gap or delay in data underlying the indicator