SMART Indicator Report: Recreational HMS
1 Descriptive Section
1.2 Indicator name
Recreational HMS
Includes variable(s): LargeCoastal-MAB, LargeCoastal-NE, Prohibited-MAB, Prohibited-NE, SmallCoastal-MAB, SmallCoastal-NE
2 SMART Attribute Section
2.1 Indicator documentation
2.1.1 Are indicators available for others to use (data downloadable)?
Yes
2.1.1.1 Where can indicators be found?
Data: https://noaa-edab.github.io/ecodata/index.html
Description: https://noaa-edab.github.io/catalog/rec_hms.html
Technical documentation: https://noaa-edab.github.io/tech-doc/rec_hms.html
2.1.1.2 How often are they updated? Are future updates likely?
[need sequential look at datasets for update frequency. Future requires judgement]
2.1.1.3 Who is the contact?
Brandon Beltz (brandon.beltz@noaa.gov)
2.1.2 Gather indicator statistics
2.1.2.1 Units
Indicator | Units |
|---|---|
LargeCoastal-MAB | no Units field |
LargeCoastal-NE | no Units field |
Prohibited-MAB | no Units field |
Prohibited-NE | no Units field |
SmallCoastal-MAB | no Units field |
SmallCoastal-NE | no Units field |
2.1.2.2 Length of time series, start and end date, periodicity
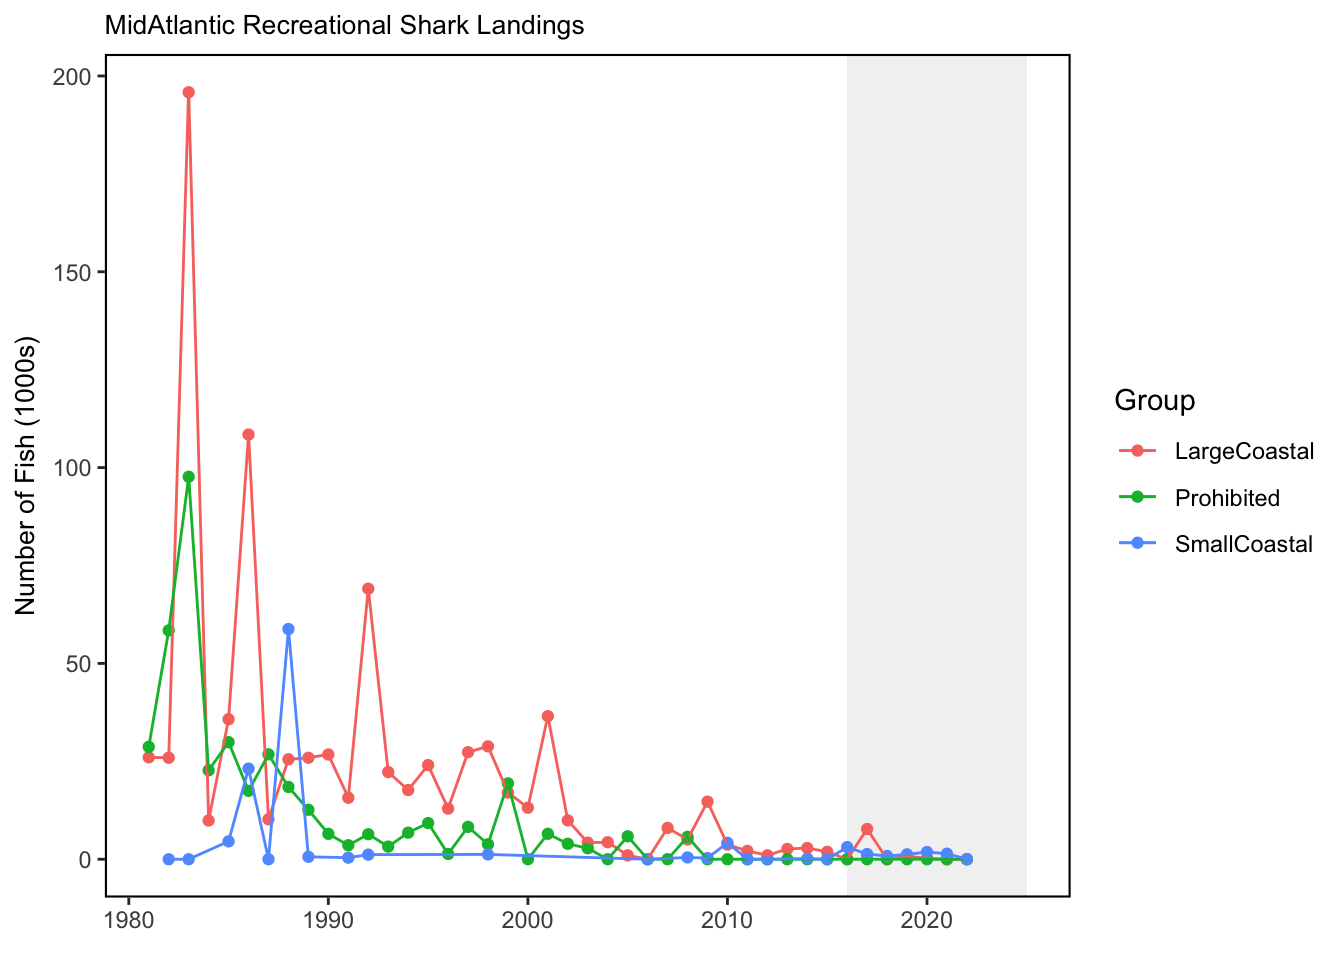
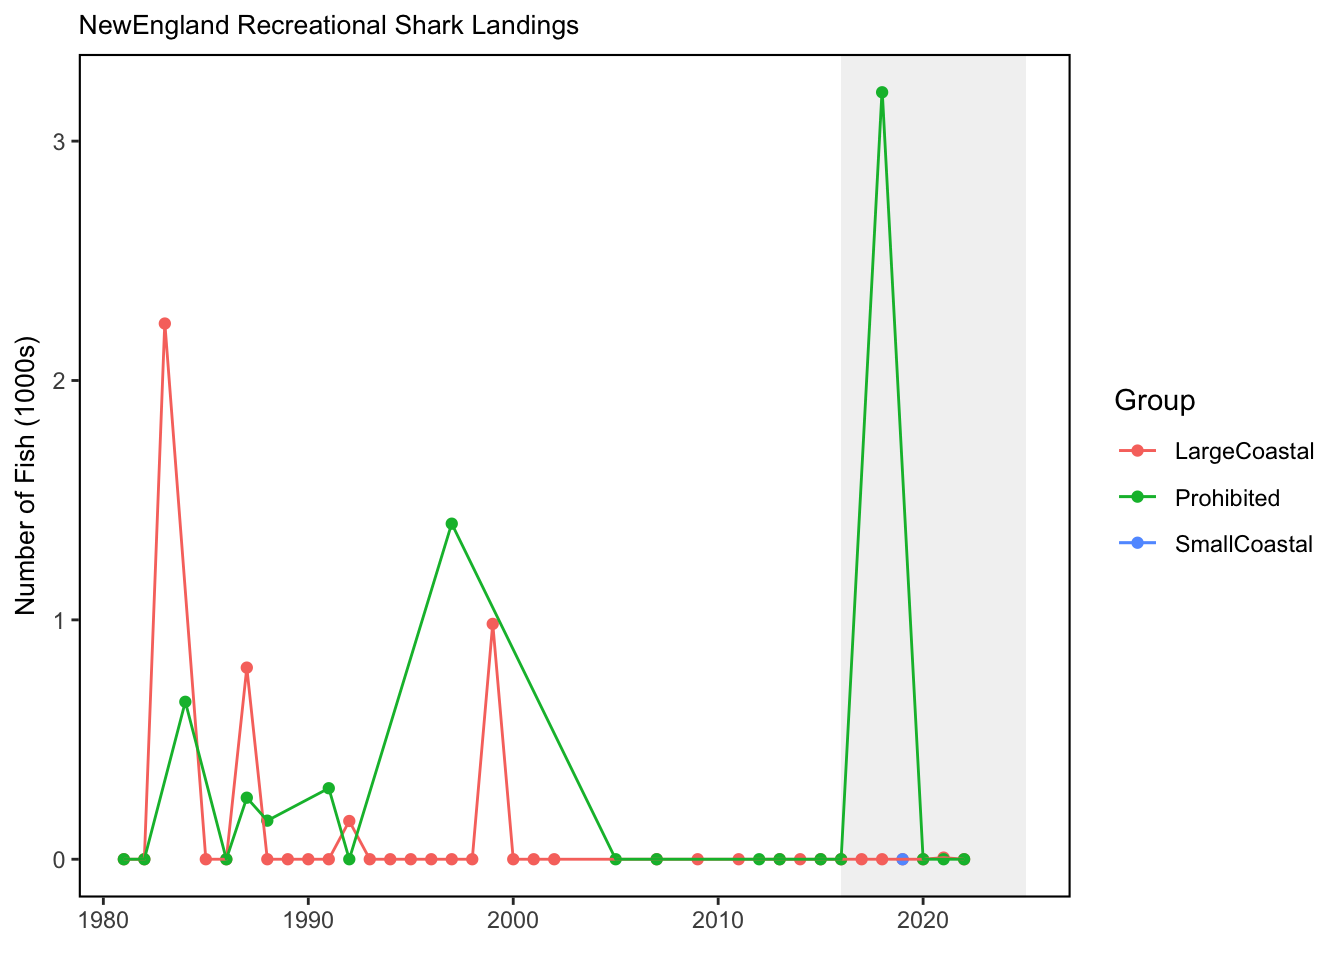
General overview: annually from 1981 to 2022
Indicator specifics:
Indicator | EPU | StartYear | EndYear | NumYears | MissingYears |
|---|---|---|---|---|---|
LargeCoastal-MAB | MAB | 1981 | 2022 | 42 | 0 |
LargeCoastal-NE | NE | 1981 | 2022 | 34 | 8 |
Prohibited-MAB | MAB | 1981 | 2022 | 42 | 0 |
Prohibited-NE | NE | 1981 | 2022 | 19 | 23 |
SmallCoastal-MAB | MAB | 1982 | 2022 | 25 | 16 |
SmallCoastal-NE | NE | 2019 | 2019 | 1 | 0 |
2.1.2.3 Spatial location, scale and extent
General overview: by EPU
Indicator specifics:
Indicator | EPU |
|---|---|
LargeCoastal-MAB | MAB |
LargeCoastal-NE | NE |
Prohibited-MAB | MAB |
Prohibited-NE | NE |
SmallCoastal-MAB | MAB |
SmallCoastal-NE | NE |
2.1.3 Are methods clearly documented to obtain source data and calculate indicators?
Yes
2.1.3.1 Can the indicator be calculated from current documentation?
Data regions “4 = New England” and “5 = Mid-Atlantic” were selected for to remove data from regions not relevant to the State of the Ecosystem reports. The data were then grouped into categories using the table below. This species list was the list used in the above “species” section in the MRIP query. Data were grouped by year, category and region, and the sum of all the landings for each was used as the indicator for recreational shark harvest.
2.1.4 Are indicator underlying source data linked or easy to find?
Data sets are publicly available (see Data Sources below).
2.1.4.1 Where are source data stored?
All recreational shark fishing indicator data were downloaded from the Marine Recreational Information Program MRIP Recreational Fisheries Statistics Queries portal. From the main Recreational fisheries statistics queries page, the download query link is available. From here the following selections made include: The ZIP file was used in the following analysis.
2.1.4.2 How/by whom are source data updated? Are future updates likely?
Kimberly Bastille, kimberly.bastille@noaa.gov
[likelihood of source data updates requires judgement, enter by hand]
2.2 Indicator analysis/testing or history of use
2.2.1 What decision or advice processes are the indicators currently used in?
Recreational shark landings pulled from the MRIP database
2.2.2 What implications of the indicators are currently listed?
Sharks are landed recreationally in quantities that are relevant to fisheries management. These landings should be considered when assessing the populations of sharks.
2.2.4 Have the indicators been tested to ensure they respond proportionally to a change in the underlying process?
No
3 SMART rating
Category | Indicator | Element | Attribute | Rating | ElementRating | OverallRating |
|---|---|---|---|---|---|---|
Fishery | Recreational HMS | Specific | Described | 1.0 | 0.5000000 | 0.5833333 |
Fishery | Recreational HMS | Specific | Units | 0.0 | 0.5000000 | 0.5833333 |
Fishery | Recreational HMS | Specific | Spatial | 1.0 | 0.5000000 | 0.5833333 |
Fishery | Recreational HMS | Specific | Uncertainty | 0.0 | 0.5000000 | 0.5833333 |
Fishery | Recreational HMS | Specific | Methods | 1.0 | 0.5000000 | 0.5833333 |
Fishery | Recreational HMS | Specific | Code | 0.0 | 0.5000000 | 0.5833333 |
Fishery | Recreational HMS | Measurable | Available | 1.0 | 1.0000000 | 0.5833333 |
Fishery | Recreational HMS | Measurable | Online | 1.0 | 1.0000000 | 0.5833333 |
Fishery | Recreational HMS | Measurable | Contact | 1.0 | 1.0000000 | 0.5833333 |
Fishery | Recreational HMS | Measurable | SourceDat | 1.0 | 1.0000000 | 0.5833333 |
Fishery | Recreational HMS | Measurable | SourceAvail | 1.0 | 1.0000000 | 0.5833333 |
Fishery | Recreational HMS | Measurable | SourceContact | 1.0 | 1.0000000 | 0.5833333 |
Fishery | Recreational HMS | Achievable | Tested | 0.0 | 0.0000000 | 0.5833333 |
Fishery | Recreational HMS | Achievable | Sensitivity | 0.0 | 0.0000000 | 0.5833333 |
Fishery | Recreational HMS | Achievable | TimeLag | 0.0 | 0.0000000 | 0.5833333 |
Fishery | Recreational HMS | Relevant | Advice | 1.0 | 0.6666667 | 0.5833333 |
Fishery | Recreational HMS | Relevant | Implications | 1.0 | 0.6666667 | 0.5833333 |
Fishery | Recreational HMS | Relevant | TargThresh | 0.0 | 0.6666667 | 0.5833333 |
Fishery | Recreational HMS | Timebound | Frequency | 1.0 | 0.7500000 | 0.5833333 |
Fishery | Recreational HMS | Timebound | Updated | 0.5 | 0.7500000 | 0.5833333 |
3.1 Comments
[Fill below by hand once above data complete]
3.1.1 Additional potential links to management in addition to uses listed above
3.1.2 What additional work would be needed for the Council to use the indicator?
3.1.3 What issues are caused if there is a gap or delay in data underlying the indicator