SMART Indicator Report: North Pacific Gyre Oscillation
1 Descriptive Section
1.3 Indicator brief description
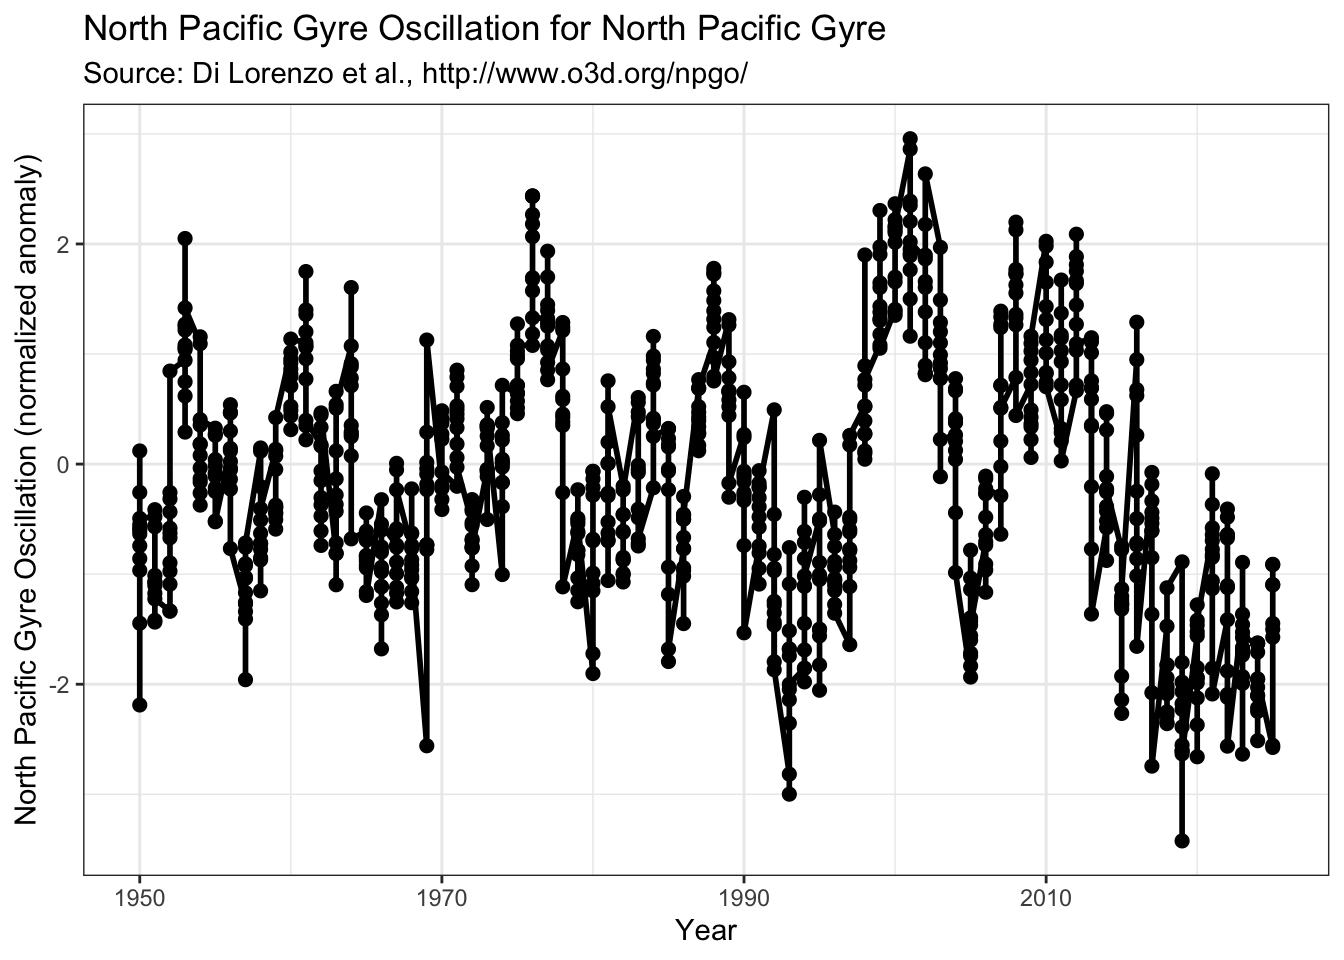
The North Pacific Gyre Oscillation (NPGO) characterizes changes in sea surface temperature and height over time in the North Pacific which are linked to ocean circulation changes that affect the distribution of salinity and nutrients in the California Current and Gulf of Alaska.
1.4 Indicator visualization
The NPGO has oscillated since 1950 between positive (stronger coastal current transport, stronger upwelling in California and downwelling in Alaska) and negative (opposite conditions) phases approximately decadally. It has remained in a negative phase for the past decade (2016-2025).
2 SMART Attribute Section
2.1 Indicator documentation
2.1.1 Are indicators available for others to use (data downloadable)?
Yes
2.1.1.1 Where can indicators be found?
All marea indicators are here: https://github.com/MarEcosystemApproaches/marea
2.1.1.3 Who is the contact?
Jamie C. Tam jamie.tam@dfo-mpo.gc.ca
2.1.2 Gather indicator statistics
2.1.2.2 Length of time series, start and end date, periodicity
General overview: Annual and Monthly
Indicator specifics:
Indicator | EPU | StartYear | EndYear |
|---|---|---|---|
North Pacific Gyre Oscillation | North Pacific Gyre | 1950 | 2025 |
2.1.2.3 Spatial location, scale and extent
General overview: NPGO
Indicator specifics:
Indicator | EPU |
|---|---|
North Pacific Gyre Oscillation | North Pacific Gyre |
2.1.3 Are methods clearly documented to obtain source data and calculate indicators?
No methods documentation is provided
2.1.3.1 Can the indicator be calculated from current documentation?
No. No methods documentation is provided
2.1.3.3 Have methods changed over time?
Yes. The original study (https://agupubs.onlinelibrary.wiley.com/doi/10.1029/2007GL032838) used one set of input data for sea surface height, which has been replaced with a newer data source in the NPGO calculations past 2004.
2.1.4 Are indicator underlying source data linked or easy to find?
Yes. Source information included: Di Lorenzo et al., http://www.o3d.org/npgo/
2.1.4.1 Where are source data stored?
Source data stored at Di Lorenzo et al., http://www.o3d.org/npgo/
2.1.4.2 How/by whom are source data updated? Are future updates likely?
No. No source data steward information
2.2 Indicator analysis/testing or history of use
2.2.1 What decision or advice processes are the indicators currently used in?
None known in the Mid-Atlantic.
2.2.2 What implications of the indicators are currently listed?
The NPGO links ocean conditions to primary productivity and therefore may help predict ecosystem productivity in the North Pacific. This indicator series is reproduced by Copernicus who note that the current negative phase corresponds to lower coastal upwelling, lower salinity at the surface, and lower nutrient concentrations, presumably in the California Current. See https://data.marine.copernicus.eu/product/OMI_EXTREME_CLIMVAR_PACIFIC_npgo_sla_eof_mode_projection/description?view=-&option=-&task=results&product_id=-
2.2.4 Have the indicators been tested to ensure they respond proportionally to a change in the underlying process?
Some testing using comparative modeling has been completed to determine whether the pattern is linked to the atmospheric driver. See https://journals.ametsoc.org/view/journals/clim/31/6/jcli-d-17-0344.1.xml
3 SMART rating
Category | Indicator | Element | Attribute | Rating | ElementRating | OverallRating |
|---|---|---|---|---|---|---|
Habitat-Physical | North Pacific Gyre Oscillation | Specific | Described | 1 | 0.5000000 | 0.6 |
Habitat-Physical | North Pacific Gyre Oscillation | Specific | Units | 1 | 0.5000000 | 0.6 |
Habitat-Physical | North Pacific Gyre Oscillation | Specific | Spatial | 1 | 0.5000000 | 0.6 |
Habitat-Physical | North Pacific Gyre Oscillation | Specific | Uncertainty | 0 | 0.5000000 | 0.6 |
Habitat-Physical | North Pacific Gyre Oscillation | Specific | Methods | 0 | 0.5000000 | 0.6 |
Habitat-Physical | North Pacific Gyre Oscillation | Specific | Code | 0 | 0.5000000 | 0.6 |
Habitat-Physical | North Pacific Gyre Oscillation | Measurable | Available | 1 | 0.8333333 | 0.6 |
Habitat-Physical | North Pacific Gyre Oscillation | Measurable | Online | 1 | 0.8333333 | 0.6 |
Habitat-Physical | North Pacific Gyre Oscillation | Measurable | Contact | 1 | 0.8333333 | 0.6 |
Habitat-Physical | North Pacific Gyre Oscillation | Measurable | SourceDat | 1 | 0.8333333 | 0.6 |
Habitat-Physical | North Pacific Gyre Oscillation | Measurable | SourceAvail | 1 | 0.8333333 | 0.6 |
Habitat-Physical | North Pacific Gyre Oscillation | Measurable | SourceContact | 0 | 0.8333333 | 0.6 |
Habitat-Physical | North Pacific Gyre Oscillation | Achievable | Tested | 1 | 0.3333333 | 0.6 |
Habitat-Physical | North Pacific Gyre Oscillation | Achievable | Sensitivity | 0 | 0.3333333 | 0.6 |
Habitat-Physical | North Pacific Gyre Oscillation | Achievable | TimeLag | 0 | 0.3333333 | 0.6 |
Habitat-Physical | North Pacific Gyre Oscillation | Relevant | Advice | 0 | 0.3333333 | 0.6 |
Habitat-Physical | North Pacific Gyre Oscillation | Relevant | Implications | 1 | 0.3333333 | 0.6 |
Habitat-Physical | North Pacific Gyre Oscillation | Relevant | TargThresh | 0 | 0.3333333 | 0.6 |
Habitat-Physical | North Pacific Gyre Oscillation | Timebound | Frequency | 1 | 1.0000000 | 0.6 |
Habitat-Physical | North Pacific Gyre Oscillation | Timebound | Updated | 1 | 1.0000000 | 0.6 |
3.1 Comments
3.1.1 Additional potential links to management in addition to uses listed above
[Select from list of management processes/actions using exact keywords]
3.1.2 What additional work would be needed for the Council to use the indicator?
[List current gaps in the indicator given the current or potentail uses listed above, what resources are needed?]
3.1.3 What issues are caused if there is a gap or delay in data underlying the indicator
[Link to management process/actions and their requirements]