SMART Indicator Report: NE Shelf Annual Sea Surface Temperature (SST)
1 Descriptive Section
1.2 Indicator name
NE Shelf Annual Sea Surface Temperature (SST)
Includes variable(s): long-term sst
2 SMART Attribute Section
2.1 Indicator documentation
2.1.1 Are indicators available for others to use (data downloadable)?
Yes
2.1.1.1 Where can indicators be found?
Data: https://noaa-edab.github.io/ecodata/index.html
Description: https://noaa-edab.github.io/catalog/long_term_sst.html
Technical documentation: https://noaa-edab.github.io/tech-doc/long_term_sst.html
2.1.1.2 How often are they updated? Are future updates likely?
[need sequential look at datasets for update frequency. Future requires judgement]
2.1.2 Gather indicator statistics
2.1.2.2 Length of time series, start and end date, periodicity
General overview: Annual
Indicator specifics:
Indicator | EPU | StartYear | EndYear | NumYears | MissingYears |
|---|---|---|---|---|---|
long-term sst | All | 1854 | 2024 | 171 | 0 |
2.1.2.3 Spatial location, scale and extent
General overview: Full shelf
Indicator specifics:
Indicator | EPU |
|---|---|
long-term sst | All |
2.1.3 Are methods clearly documented to obtain source data and calculate indicators?
Yes
2.1.4 Are indicator underlying source data linked or easy to find?
Source data are available here.
2.1.4.1 Where are source data stored?
This indicator is derived from the NOAA ERSST V5 dataset (Huang et al. 2017b).
2.1.4.2 How/by whom are source data updated? Are future updates likely?
Brandon Beltz, Brandon.Beltz@noaa.gov
[likelihood of source data updates requires judgement, enter by hand]
2.2 Indicator analysis/testing or history of use
2.2.1 What decision or advice processes are the indicators currently used in?
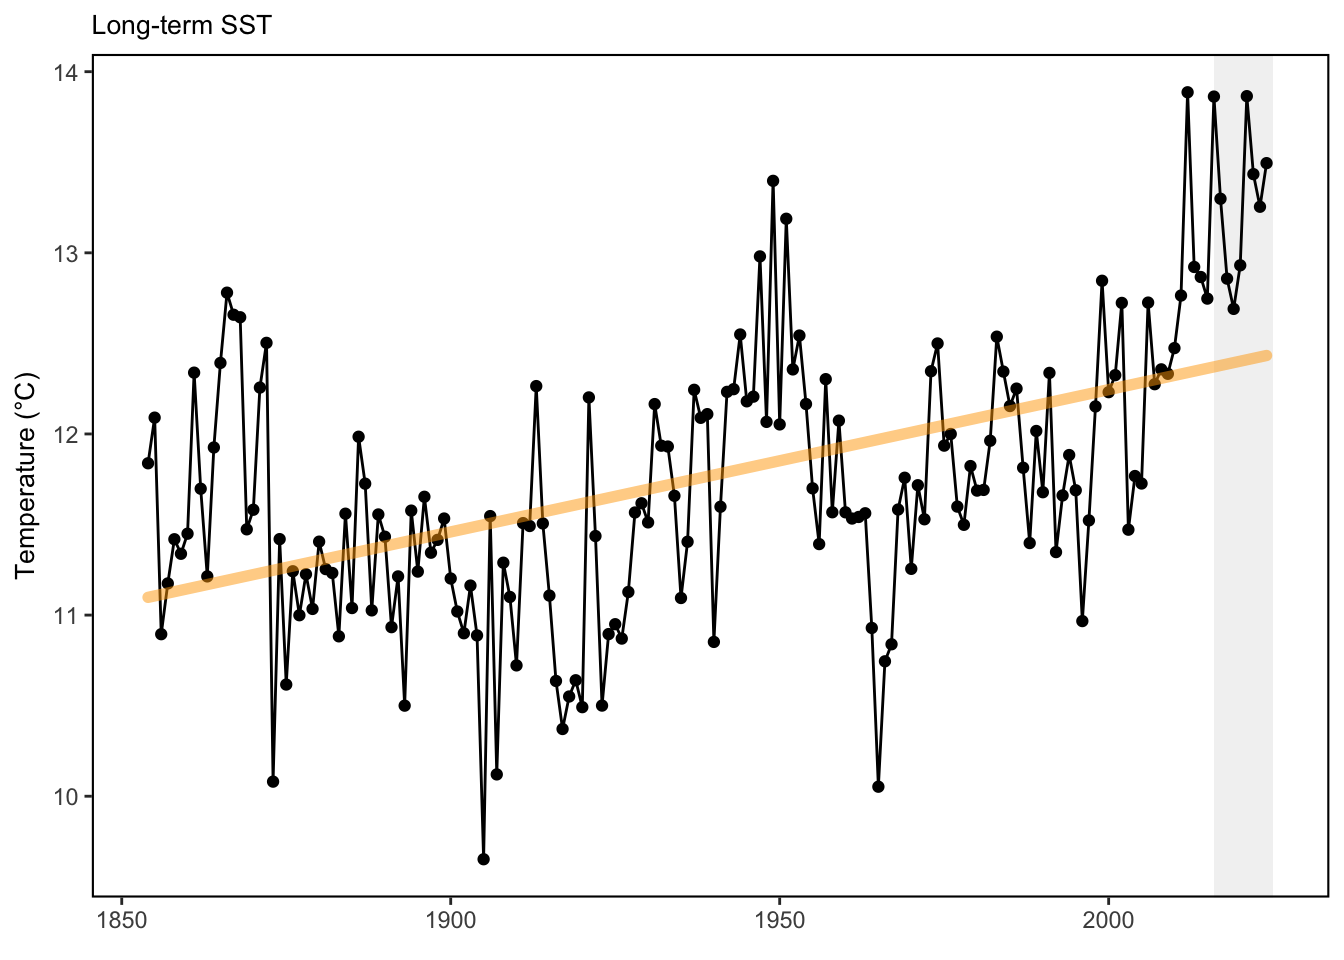
The data presented here are average annual sea-surface temperatures from the NOAA extended reconstructed sea surface temperature data set (ERSST V5) on the Northeast Continental Shelf.
2.2.2 What implications of the indicators are currently listed?
Long term SST demonstrates that the annual average sea surface temperatures observed during the most recent ten years are well above the historical average dating back to the 1860s.
2.2.4 Have the indicators been tested to ensure they respond proportionally to a change in the underlying process?
No
3 SMART rating
Category | Indicator | Element | Attribute | Rating | ElementRating | OverallRating |
|---|---|---|---|---|---|---|
Habitat-Physical | NE Shelf Annual Sea Surface Temperature (SST) | Specific | Described | 1 | 0.6666667 | 0.6666667 |
Habitat-Physical | NE Shelf Annual Sea Surface Temperature (SST) | Specific | Units | 1 | 0.6666667 | 0.6666667 |
Habitat-Physical | NE Shelf Annual Sea Surface Temperature (SST) | Specific | Spatial | 1 | 0.6666667 | 0.6666667 |
Habitat-Physical | NE Shelf Annual Sea Surface Temperature (SST) | Specific | Uncertainty | 0 | 0.6666667 | 0.6666667 |
Habitat-Physical | NE Shelf Annual Sea Surface Temperature (SST) | Specific | Methods | 1 | 0.6666667 | 0.6666667 |
Habitat-Physical | NE Shelf Annual Sea Surface Temperature (SST) | Specific | Code | 0 | 0.6666667 | 0.6666667 |
Habitat-Physical | NE Shelf Annual Sea Surface Temperature (SST) | Measurable | Available | 1 | 1.0000000 | 0.6666667 |
Habitat-Physical | NE Shelf Annual Sea Surface Temperature (SST) | Measurable | Online | 1 | 1.0000000 | 0.6666667 |
Habitat-Physical | NE Shelf Annual Sea Surface Temperature (SST) | Measurable | Contact | 1 | 1.0000000 | 0.6666667 |
Habitat-Physical | NE Shelf Annual Sea Surface Temperature (SST) | Measurable | SourceDat | 1 | 1.0000000 | 0.6666667 |
Habitat-Physical | NE Shelf Annual Sea Surface Temperature (SST) | Measurable | SourceAvail | 1 | 1.0000000 | 0.6666667 |
Habitat-Physical | NE Shelf Annual Sea Surface Temperature (SST) | Measurable | SourceContact | 1 | 1.0000000 | 0.6666667 |
Habitat-Physical | NE Shelf Annual Sea Surface Temperature (SST) | Achievable | Tested | 0 | 0.0000000 | 0.6666667 |
Habitat-Physical | NE Shelf Annual Sea Surface Temperature (SST) | Achievable | Sensitivity | 0 | 0.0000000 | 0.6666667 |
Habitat-Physical | NE Shelf Annual Sea Surface Temperature (SST) | Achievable | TimeLag | 0 | 0.0000000 | 0.6666667 |
Habitat-Physical | NE Shelf Annual Sea Surface Temperature (SST) | Relevant | Advice | 1 | 0.6666667 | 0.6666667 |
Habitat-Physical | NE Shelf Annual Sea Surface Temperature (SST) | Relevant | Implications | 1 | 0.6666667 | 0.6666667 |
Habitat-Physical | NE Shelf Annual Sea Surface Temperature (SST) | Relevant | TargThresh | 0 | 0.6666667 | 0.6666667 |
Habitat-Physical | NE Shelf Annual Sea Surface Temperature (SST) | Timebound | Frequency | 1 | 1.0000000 | 0.6666667 |
Habitat-Physical | NE Shelf Annual Sea Surface Temperature (SST) | Timebound | Updated | 1 | 1.0000000 | 0.6666667 |
3.1 Comments
[Fill below by hand once above data complete]
3.1.1 Additional potential links to management in addition to uses listed above
3.1.2 What additional work would be needed for the Council to use the indicator?
3.1.3 What issues are caused if there is a gap or delay in data underlying the indicator