SMART Indicator Report: Marine Heatwave Events
1 Descriptive Section
1.4 Indicator visualization
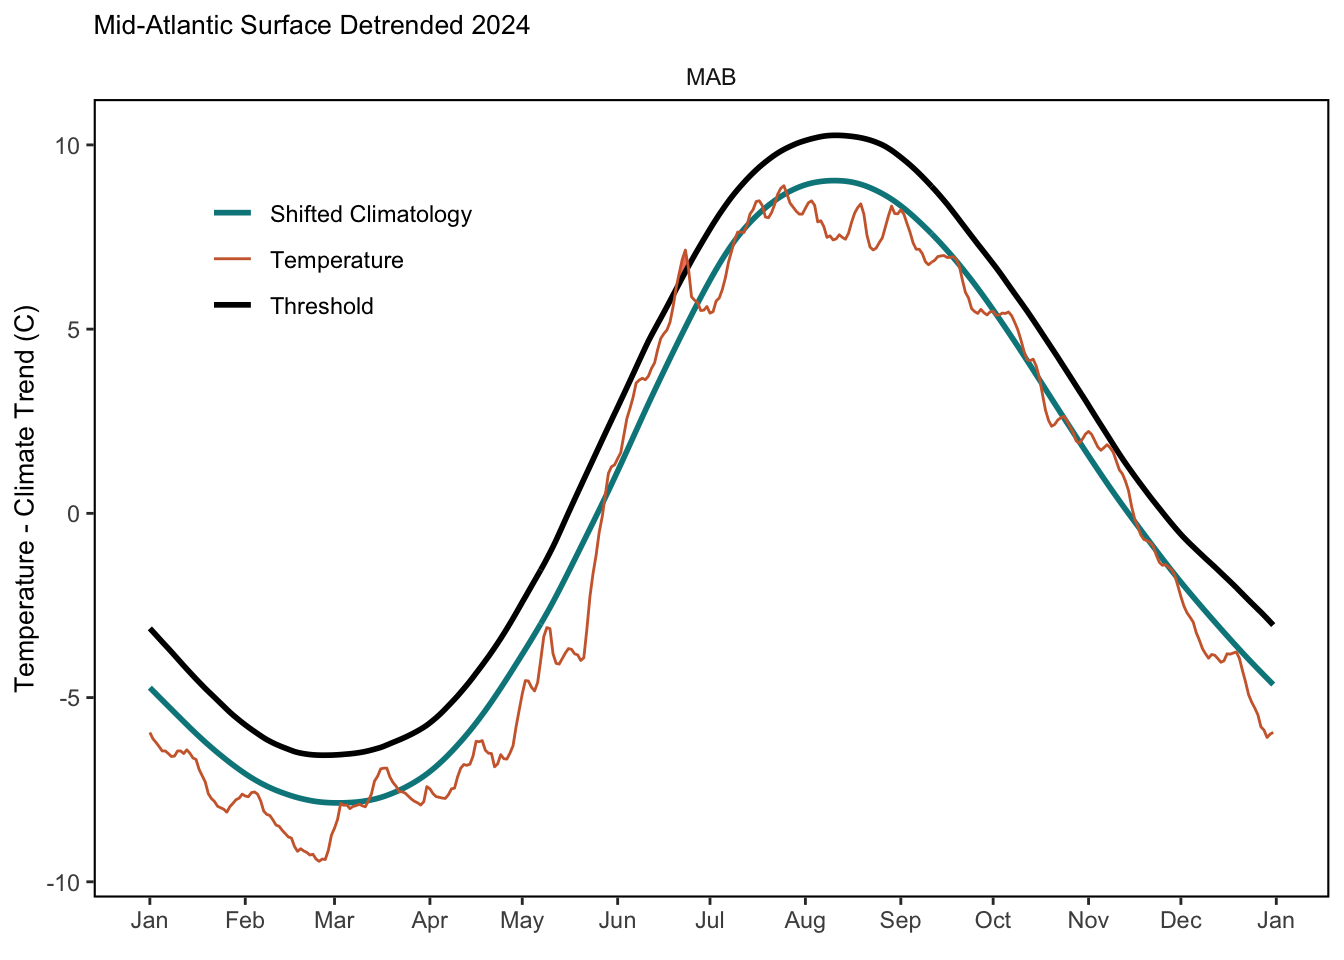
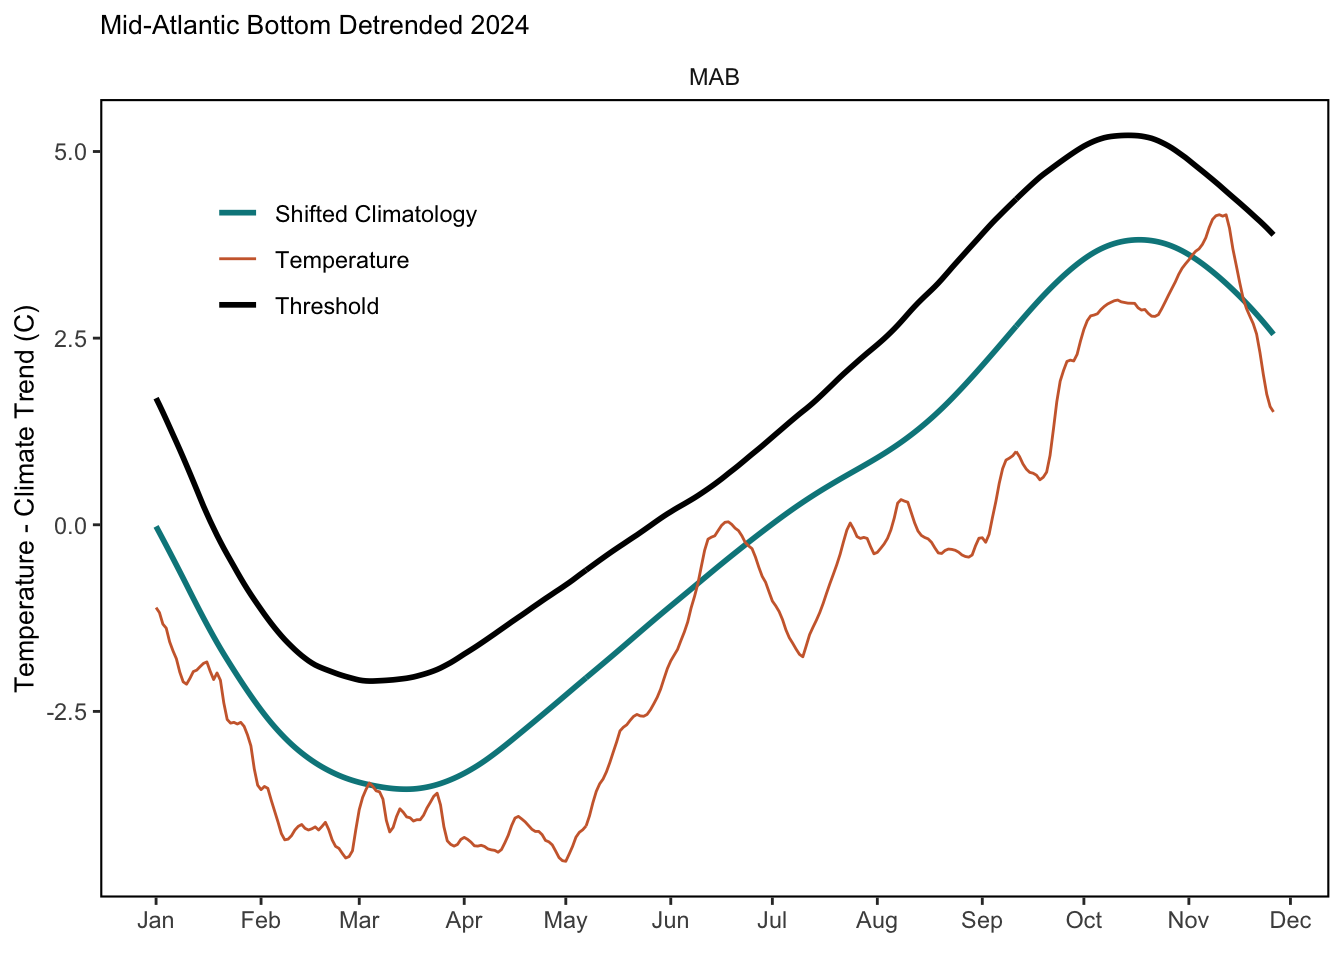
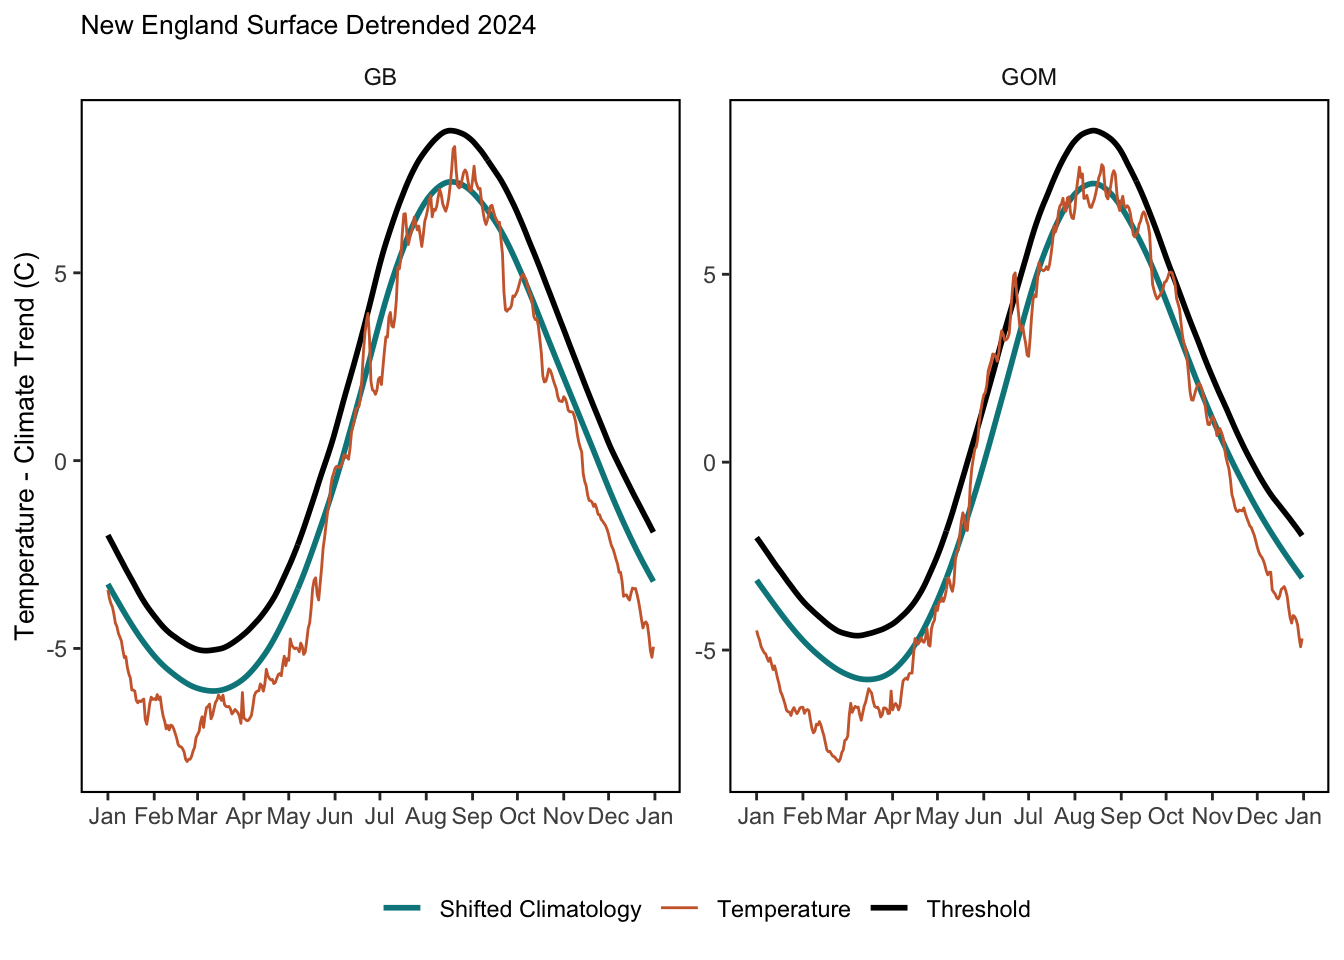
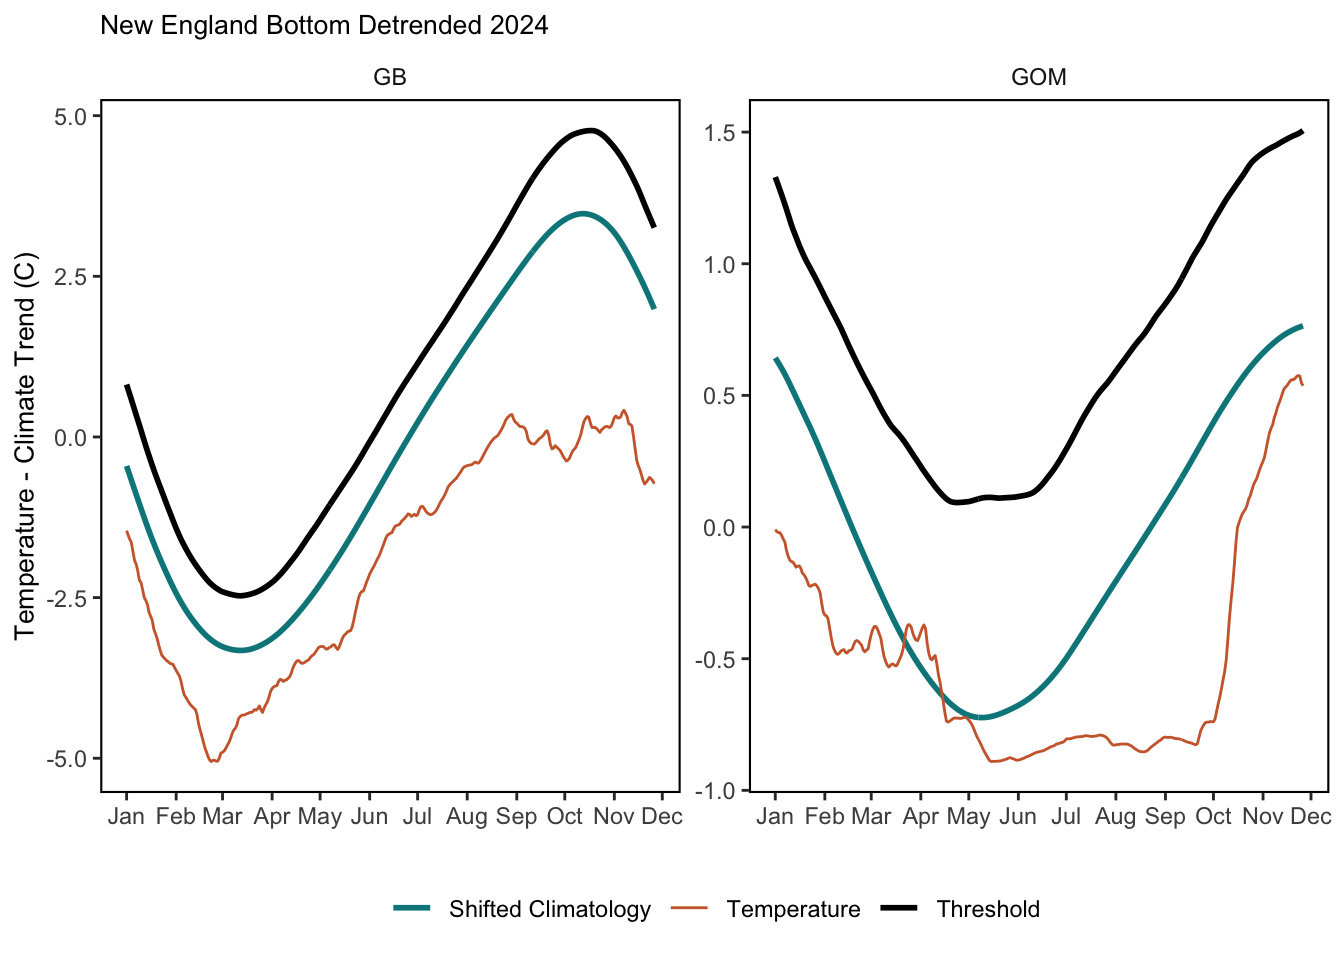
Georges Bank Surface MHWs In 2024, Georges Bank did not experience any surface MHWs. Bottom MHWs In 2024, Georges Bank did not experience any bottom MHWs. The strongest bottom MHW on record in Georges Bank was in the fall of 2016. Of the identified 13 bottom MHWs on Georges Bank between 1982 and 2023, four of the top five events in terms of maximum intensity occurred in the last decade. Gulf of Maine Surface MHWs In 2024, the Gulf of Maine experienced a surface MHW that started on May 29th and lasted 12 days. Bottom MHWs In 2024, the Gulf of Maine did not experience any bottom MHWs. Middle Atlantic Bight Surface MHWs In 2024, the Middle Atlantic Bight did not experience any surface MHWs. Bottom MHWs In 2024, the Middle Atlantic Bight did not experience any bottom MHWs. The strongest bottom MHW occurred in the fall of 1985.
2 SMART Attribute Section
2.1 Indicator documentation
2.1.1 Are indicators available for others to use (data downloadable)?
Yes
2.1.1.1 Where can indicators be found?
Data: https://noaa-edab.github.io/ecodata/index.html
Description: https://noaa-edab.github.io/catalog/heatwave_year.html
Technical documentation: https://noaa-edab.github.io/tech-doc/heatwave_year.html
2.1.1.2 How often are they updated? Are future updates likely?
[need sequential look at datasets for update frequency. Future requires judgement]
2.1.1.3 Who is the contact?
Vincent Saba (vincent.saba@noaa.gov)
2.1.2 Gather indicator statistics
2.1.2.2 Length of time series, start and end date, periodicity
General overview: Daily
Indicator specifics:
Indicator | Varname |
|---|---|
SurfaceDetrended | no Time Variables |
BottomDetrended | no Time Variables |
2.1.2.3 Spatial location, scale and extent
General overview: EPU
Indicator specifics:
Indicator | EPU |
|---|---|
SurfaceDetrended | GB |
SurfaceDetrended | GOM |
SurfaceDetrended | MAB |
BottomDetrended | GB |
BottomDetrended | GOM |
BottomDetrended | MAB |
2.2 Indicator analysis/testing or history of use
2.2.1 What decision or advice processes are the indicators currently used in?
Marine heatwaves (MHWs) measure not just temperature, but how long the ecosystem is subjected to the high temperature. They are driven by both atmospheric and oceanographic factors and can have dramatic impacts on marine ecosystems. Marine heatwaves are measured in terms of intensity (water temperature) and duration (the cumulative number of degree days) using measurements of sea surface temperature (surface MHWs) or models of bottom temperature (bottom MHWs). Recent research ([99] and [100]) have modified the original MHW methodology, [101]. The MHW indices for both surface and bottom use temperature time-series data that are detrended and the entire time-series are used as the climatology (e.g. 1982-2024 in this SOE). Surface MHW events are based on the criteria of a warming event that lasts for five or more days with sea surface temperatures above the 90th percentile of the historical daily climatology (1982-2024). Bottom MHW events are based on the criteria of a warming event that lasts for thirty or more days with bottom temperatures above the 90th percentile of the historical daily climatology (1982-2024). The longer time period criterion for bottom temperature is due to the longer persistence time of ocean bottom temperature anomalies in the U.S. northeast shelf ([82]). The new MHW indices can now discern extreme events that truly are “extreme” rather than occupying most of the year. Because this approach moves from a fixed baseline to a shifting baseline by detrending ocean temperature data and using the entire time-series as a climatology, the global warming signal is removed and thus we are left with extremes in the variability of ocean temperature. To assess total heat stress on marine organisms, one can combine long-term ocean warming and MHWs. Therefore, the 2025 SOE also reports on long-term SST and bottom temperature time-series that clearly show the decadal ocean warming trend.
2.2.2 What implications of the indicators are currently listed?
Implications of MHWs on living marine resources in the U.S.NES are currently being investigated. The 2012 surface MHW events in the Gulf of Maine did have impacts on the lobster fishery in the summer and fall of 2012.
2.2.4 Have the indicators been tested to ensure they respond proportionally to a change in the underlying process?
No
3 SMART rating
Category | Indicator | Element | Attribute | Rating | ElementRating | OverallRating |
|---|---|---|---|---|---|---|
Habitat-Physical | Marine Heatwave Events | Specific | Described | 1 | 0.5000000 | 0.4333333 |
Habitat-Physical | Marine Heatwave Events | Specific | Units | 0 | 0.5000000 | 0.4333333 |
Habitat-Physical | Marine Heatwave Events | Specific | Spatial | 1 | 0.5000000 | 0.4333333 |
Habitat-Physical | Marine Heatwave Events | Specific | Uncertainty | 0 | 0.5000000 | 0.4333333 |
Habitat-Physical | Marine Heatwave Events | Specific | Methods | 1 | 0.5000000 | 0.4333333 |
Habitat-Physical | Marine Heatwave Events | Specific | Code | 0 | 0.5000000 | 0.4333333 |
Habitat-Physical | Marine Heatwave Events | Measurable | Available | 1 | 0.5000000 | 0.4333333 |
Habitat-Physical | Marine Heatwave Events | Measurable | Online | 1 | 0.5000000 | 0.4333333 |
Habitat-Physical | Marine Heatwave Events | Measurable | Contact | 1 | 0.5000000 | 0.4333333 |
Habitat-Physical | Marine Heatwave Events | Measurable | SourceDat | 0 | 0.5000000 | 0.4333333 |
Habitat-Physical | Marine Heatwave Events | Measurable | SourceAvail | 0 | 0.5000000 | 0.4333333 |
Habitat-Physical | Marine Heatwave Events | Measurable | SourceContact | 0 | 0.5000000 | 0.4333333 |
Habitat-Physical | Marine Heatwave Events | Achievable | Tested | 0 | 0.0000000 | 0.4333333 |
Habitat-Physical | Marine Heatwave Events | Achievable | Sensitivity | 0 | 0.0000000 | 0.4333333 |
Habitat-Physical | Marine Heatwave Events | Achievable | TimeLag | 0 | 0.0000000 | 0.4333333 |
Habitat-Physical | Marine Heatwave Events | Relevant | Advice | 1 | 0.6666667 | 0.4333333 |
Habitat-Physical | Marine Heatwave Events | Relevant | Implications | 1 | 0.6666667 | 0.4333333 |
Habitat-Physical | Marine Heatwave Events | Relevant | TargThresh | 0 | 0.6666667 | 0.4333333 |
Habitat-Physical | Marine Heatwave Events | Timebound | Frequency | 1 | 0.5000000 | 0.4333333 |
Habitat-Physical | Marine Heatwave Events | Timebound | Updated | 0 | 0.5000000 | 0.4333333 |
3.1 Comments
[Fill below by hand once above data complete]
3.1.1 Additional potential links to management in addition to uses listed above
3.1.2 What additional work would be needed for the Council to use the indicator?
3.1.3 What issues are caused if there is a gap or delay in data underlying the indicator