SMART Indicator Report: Inshore Survey (Mid Atlantic)
1 Descriptive Section
1.2 Indicator name
Inshore Survey (Mid Atlantic)
Includes variable(s): Benthivore Fall-CV, Benthivore Fall-Value, Benthivore Spring-CV, Benthivore Spring-Value, Benthos Fall-CV, Benthos Fall-Value, Benthos Spring-CV, Benthos Spring-Value, Piscivore Fall-CV, Piscivore Fall-Value, Piscivore Spring-CV, Piscivore Spring-Value, Planktivore Fall-CV, Planktivore Fall-Value, Planktivore Spring-CV, Planktivore Spring-Value
2 SMART Attribute Section
2.1 Indicator documentation
2.1.1 Are indicators available for others to use (data downloadable)?
Yes
2.1.1.1 Where can indicators be found?
Data: https://noaa-edab.github.io/ecodata/index.html
Description: https://noaa-edab.github.io/catalog/mab_inshore_survey.html
Technical documentation: https://noaa-edab.github.io/tech-doc/mab_inshore_survey.html
2.1.1.2 How often are they updated? Are future updates likely?
[need sequential look at datasets for update frequency. Future requires judgement]
2.1.1.3 Who is the contact?
James Gartland (NEAMAP), jgartlan@vims.edu; Rebecca Peters (ME/NH survey), rebecca.j.peters@maine.gov; Sean Lucey (MA Inshore Survey), sean.lucey@rws.com
2.1.2 Gather indicator statistics
2.1.2.1 Units
Indicator | Units |
|---|---|
Benthivore Fall-CV | no Units field |
Benthivore Fall-Value | no Units field |
Benthivore Spring-CV | no Units field |
Benthivore Spring-Value | no Units field |
Benthos Fall-CV | no Units field |
Benthos Fall-Value | no Units field |
Benthos Spring-CV | no Units field |
Benthos Spring-Value | no Units field |
Piscivore Fall-CV | no Units field |
Piscivore Fall-Value | no Units field |
Piscivore Spring-CV | no Units field |
Piscivore Spring-Value | no Units field |
Planktivore Fall-CV | no Units field |
Planktivore Fall-Value | no Units field |
Planktivore Spring-CV | no Units field |
Planktivore Spring-Value | no Units field |
2.1.2.2 Length of time series, start and end date, periodicity
General overview: Spring and Fall
Indicator specifics:
Indicator | EPU | StartYear | EndYear | NumYears | MissingYears |
|---|---|---|---|---|---|
Benthivore Fall-CV | MAB | 2007 | 2024 | 18 | 0 |
Benthivore Fall-Value | MAB | 2007 | 2024 | 18 | 0 |
Benthivore Spring-CV | MAB | 2008 | 2024 | 17 | 0 |
Benthivore Spring-Value | MAB | 2008 | 2024 | 17 | 0 |
Benthos Fall-CV | MAB | 2007 | 2024 | 18 | 0 |
Benthos Fall-Value | MAB | 2007 | 2024 | 18 | 0 |
Benthos Spring-CV | MAB | 2008 | 2024 | 17 | 0 |
Benthos Spring-Value | MAB | 2008 | 2024 | 17 | 0 |
Piscivore Fall-CV | MAB | 2007 | 2024 | 18 | 0 |
Piscivore Fall-Value | MAB | 2007 | 2024 | 18 | 0 |
Piscivore Spring-CV | MAB | 2008 | 2024 | 17 | 0 |
Piscivore Spring-Value | MAB | 2008 | 2024 | 17 | 0 |
Planktivore Fall-CV | MAB | 2007 | 2024 | 18 | 0 |
Planktivore Fall-Value | MAB | 2007 | 2024 | 18 | 0 |
Planktivore Spring-CV | MAB | 2008 | 2024 | 17 | 0 |
Planktivore Spring-Value | MAB | 2008 | 2024 | 17 | 0 |
2.1.2.3 Spatial location, scale and extent
General overview: Nearshore regions of the MAB and GOM
Indicator specifics:
Indicator | EPU |
|---|---|
Benthivore Fall-CV | MAB |
Benthivore Fall-Value | MAB |
Benthivore Spring-CV | MAB |
Benthivore Spring-Value | MAB |
Benthos Fall-CV | MAB |
Benthos Fall-Value | MAB |
Benthos Spring-CV | MAB |
Benthos Spring-Value | MAB |
Piscivore Fall-CV | MAB |
Piscivore Fall-Value | MAB |
Piscivore Spring-CV | MAB |
Piscivore Spring-Value | MAB |
Planktivore Fall-CV | MAB |
Planktivore Fall-Value | MAB |
Planktivore Spring-CV | MAB |
Planktivore Spring-Value | MAB |
2.2 Indicator analysis/testing or history of use
2.2.1 What decision or advice processes are the indicators currently used in?
Indicators from these inshore surveys are analogous to those produced by the NEFSC trawl survey in the aggregate survey biomass indicator dataset.
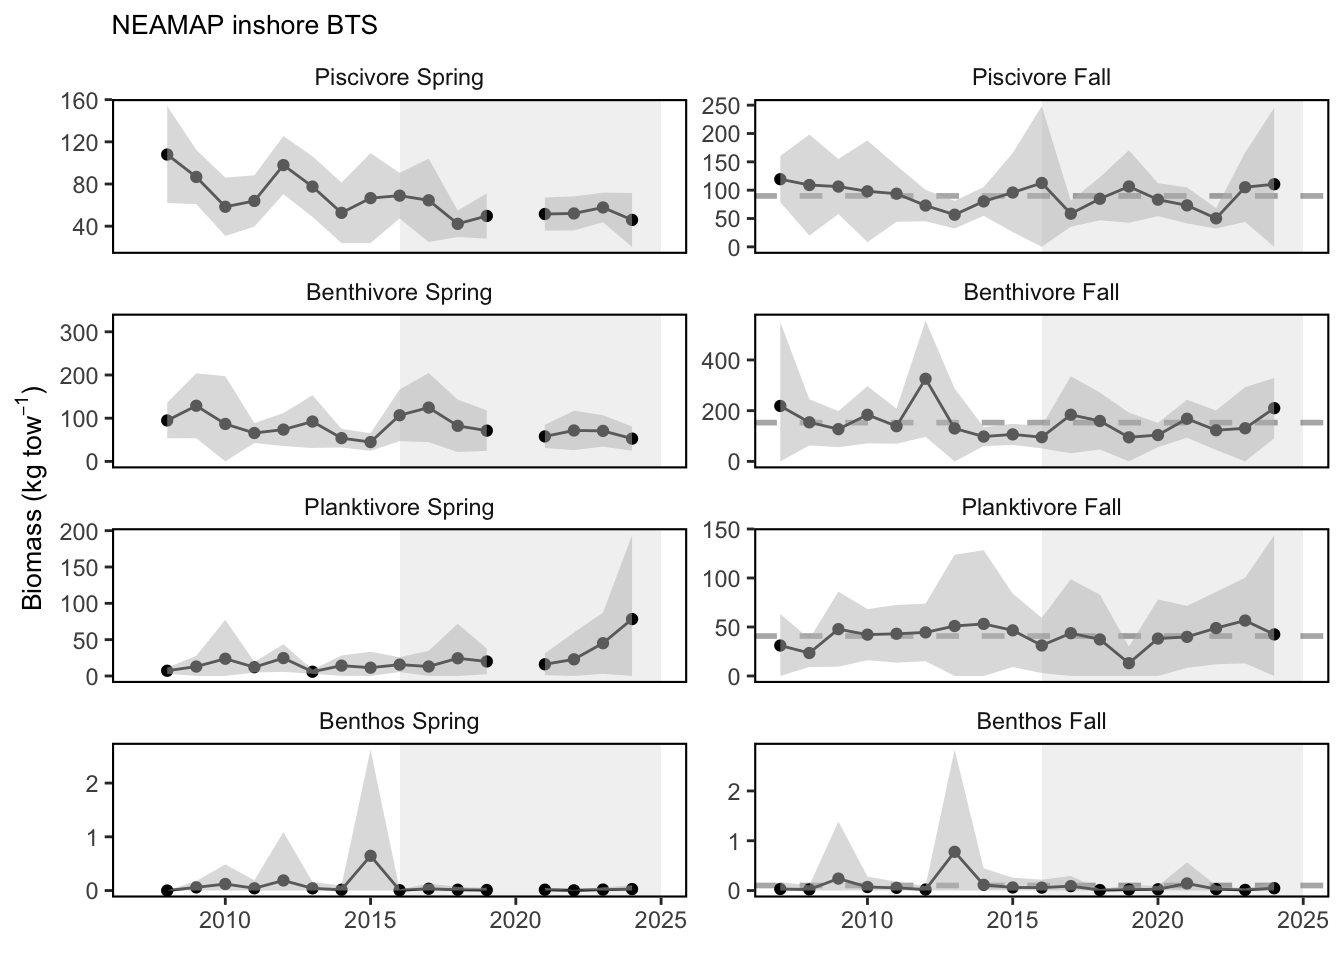
2.2.2 What implications of the indicators are currently listed?
The trends in the NEAMAP inshore survey vary compared to the NEFSC survey. This is driven by different species availability to surveys in time and space as well as the surveys sampling different habitats. Nearshore habitats are important to fish and fisheries so we monitor them as as well as trends from the larger EPUs.
2.2.4 Have the indicators been tested to ensure they respond proportionally to a change in the underlying process?
No
3 SMART rating
Category | Indicator | Element | Attribute | Rating | ElementRating | OverallRating |
|---|---|---|---|---|---|---|
Fish | Inshore Survey (Mid Atlantic) | Specific | Described | 1 | 0.6666667 | 0.5666667 |
Fish | Inshore Survey (Mid Atlantic) | Specific | Units | 0 | 0.6666667 | 0.5666667 |
Fish | Inshore Survey (Mid Atlantic) | Specific | Spatial | 1 | 0.6666667 | 0.5666667 |
Fish | Inshore Survey (Mid Atlantic) | Specific | Uncertainty | 1 | 0.6666667 | 0.5666667 |
Fish | Inshore Survey (Mid Atlantic) | Specific | Methods | 1 | 0.6666667 | 0.5666667 |
Fish | Inshore Survey (Mid Atlantic) | Specific | Code | 0 | 0.6666667 | 0.5666667 |
Fish | Inshore Survey (Mid Atlantic) | Measurable | Available | 1 | 0.5000000 | 0.5666667 |
Fish | Inshore Survey (Mid Atlantic) | Measurable | Online | 1 | 0.5000000 | 0.5666667 |
Fish | Inshore Survey (Mid Atlantic) | Measurable | Contact | 1 | 0.5000000 | 0.5666667 |
Fish | Inshore Survey (Mid Atlantic) | Measurable | SourceDat | 0 | 0.5000000 | 0.5666667 |
Fish | Inshore Survey (Mid Atlantic) | Measurable | SourceAvail | 0 | 0.5000000 | 0.5666667 |
Fish | Inshore Survey (Mid Atlantic) | Measurable | SourceContact | 0 | 0.5000000 | 0.5666667 |
Fish | Inshore Survey (Mid Atlantic) | Achievable | Tested | 0 | 0.0000000 | 0.5666667 |
Fish | Inshore Survey (Mid Atlantic) | Achievable | Sensitivity | 0 | 0.0000000 | 0.5666667 |
Fish | Inshore Survey (Mid Atlantic) | Achievable | TimeLag | 0 | 0.0000000 | 0.5666667 |
Fish | Inshore Survey (Mid Atlantic) | Relevant | Advice | 1 | 0.6666667 | 0.5666667 |
Fish | Inshore Survey (Mid Atlantic) | Relevant | Implications | 1 | 0.6666667 | 0.5666667 |
Fish | Inshore Survey (Mid Atlantic) | Relevant | TargThresh | 0 | 0.6666667 | 0.5666667 |
Fish | Inshore Survey (Mid Atlantic) | Timebound | Frequency | 1 | 1.0000000 | 0.5666667 |
Fish | Inshore Survey (Mid Atlantic) | Timebound | Updated | 1 | 1.0000000 | 0.5666667 |
3.1 Comments
[Fill below by hand once above data complete]
3.1.1 Additional potential links to management in addition to uses listed above
3.1.2 What additional work would be needed for the Council to use the indicator?
3.1.3 What issues are caused if there is a gap or delay in data underlying the indicator