SMART Indicator Report: Harmful Algal Blooms
1 Descriptive Section
1.2 Indicator name
Harmful Algal Blooms
Includes variable(s): Bay_of_Fundy Alexandrium, East_Gulf_of_Maine Alexandrium, Gulf_of_Maine_All Alexandrium, MA PSP, ME PSP, NH PSP, West_Gulf_of_Maine Alexandrium
1.3 Indicator brief description
These data represent annual estimated abundance of Alexandrium catanella cysts in the Gulf of Maine from 2003 to 2023.
1.4 Indicator visualization
Visualizations of the data include an annual time series plot of estimated cyst abundance, and a time series of maps depicting the spatial and temporal variability in the Gulf of Maine. Results are plotted as estimated total numbers of cells (10 to the 16th power) in Eastern Gulf of Maine (east of Penobscot Bay), Western Gulf of Maine (west of Penobscot Bay), Bay of Fundy, and entire Gulf of Maine.
## [1] "This indicator is only present in the 'NewEngland' report"## [1] "This indicator is only present in the 'NewEngland' report"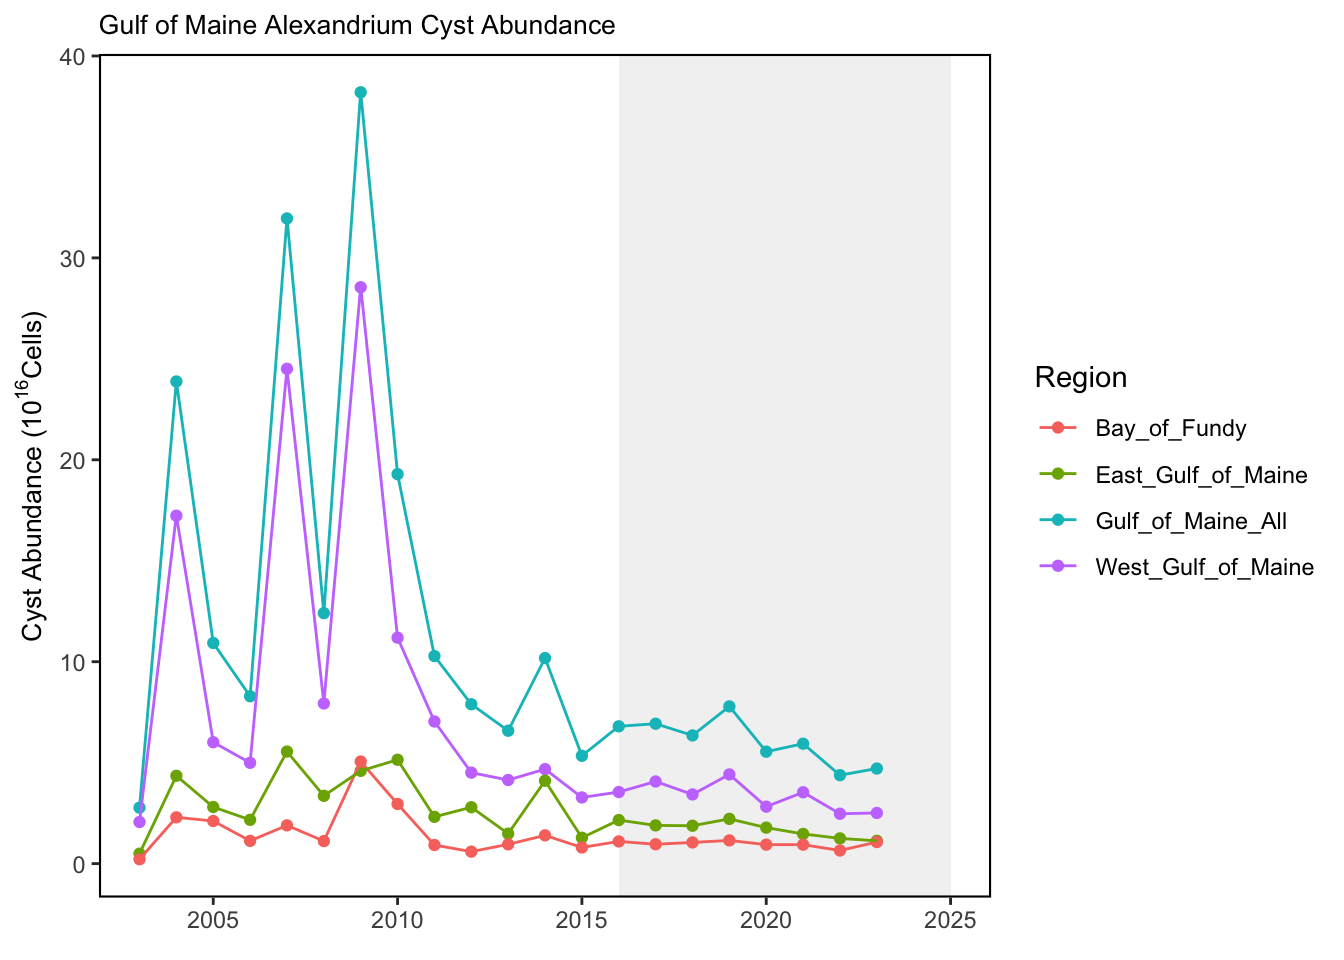
2 SMART Attribute Section
2.1 Indicator documentation
2.1.1 Are indicators available for others to use (data downloadable)?
Yes
2.1.1.1 Where can indicators be found?
Data: https://noaa-edab.github.io/ecodata/index.html
Description: https://noaa-edab.github.io/catalog/habs.html
Technical documentation: https://noaa-edab.github.io/tech-doc/habs.html
2.1.1.2 How often are they updated? Are future updates likely?
[need sequential look at datasets for update frequency. Future requires judgement]
2.1.1.3 Who is the contact?
Moe Nelson, david.moe.nelson@noaa.gov
2.1.2 Gather indicator statistics
2.1.2.1 Units
Indicator | Units |
|---|---|
Bay_of_Fundy Alexandrium | no Units field |
East_Gulf_of_Maine Alexandrium | no Units field |
Gulf_of_Maine_All Alexandrium | no Units field |
MA PSP | no Units field |
ME PSP | no Units field |
NH PSP | no Units field |
West_Gulf_of_Maine Alexandrium | no Units field |
2.1.2.2 Length of time series, start and end date, periodicity
General overview: Cyst are sampled in the fall and winter months, and reported annually.
Indicator specifics:
Indicator | EPU | StartYear | EndYear | NumYears | MissingYears |
|---|---|---|---|---|---|
Bay_of_Fundy Alexandrium | GOM | 2003 | 2023 | 21 | 0 |
East_Gulf_of_Maine Alexandrium | GOM | 2003 | 2023 | 21 | 0 |
Gulf_of_Maine_All Alexandrium | GOM | 2003 | 2023 | 21 | 0 |
MA PSP | NE | 1972 | 2019 | 48 | 0 |
ME PSP | NE | 2005 | 2019 | 15 | 0 |
NH PSP | NE | 2000 | 2019 | 20 | 0 |
West_Gulf_of_Maine Alexandrium | GOM | 2003 | 2023 | 21 | 0 |
2.1.2.3 Spatial location, scale and extent
General overview: Results are reported for the entire Gulf of Maine, and parsed by sub-regions: Eastern Gulf of Maine (east of Penobscot Bay), Western Gulf of Maine (west of Penobscot Bay), and Bay of Fundy.
Indicator specifics:
Indicator | EPU |
|---|---|
Bay_of_Fundy Alexandrium | GOM |
East_Gulf_of_Maine Alexandrium | GOM |
Gulf_of_Maine_All Alexandrium | GOM |
MA PSP | NE |
ME PSP | NE |
NH PSP | NE |
West_Gulf_of_Maine Alexandrium | GOM |
2.1.3 Are methods clearly documented to obtain source data and calculate indicators?
Yes
2.1.3.1 Can the indicator be calculated from current documentation?
Tabular data provided by Yizhen Li, NOAA/NOS NCCOS Stressor Detection and Impacts Division, HAB Forecasting Branch.
The spatial distribution and abundance of cyst cells from the annual survey are used to drive an ecosystem forecast model for the Gulf of Maine (Anderson et al. (2005), Li et al. (2009), Li et al. (2020), McGillicuddy et al. (2011)). The model also includes many other inputs of dynamic oceanographic data such as currents, temperature, and nutrients. Operational Harmful Algal Bloom forecast is served online at https://coastalscience.noaa.gov/research/stressor-impacts-mitigation/hab-forecasts/gulf-of-maine-alexandrium-catenella-predictive-models/.
2.1.4 Are indicator underlying source data linked or easy to find?
Source data are NOT publicly available. Data were provided upon request by Yizhen Li. Data are also used in operational HAB forecast models, freely available to the public.
2.1.4.1 Where are source data stored?
Alexandrium cysts in sediments of the Gulf of Maine have been monitored through a cooperative effort of NOAA, WHOI, and other partners for over twenty years. Sampling methods are described in Anderson et al. (2005). In the annual survey cruises, samples are obtained with a Craib corer, and Alexandrium cysts are counted from the top 1- cm of sediment layer. Results are extrapolated to estimate overall cyst abundance in the eastern, western, and entire Gulf of Maine.Results are reported as estimated total numbers of cells (10 to the 16th power) in Eastern Gulf of Maine (east of Penobscot Bay), Western Gulf of Maine (west of Penobscot Bay), Bay of Fundy (2003-2013 only), and entire Gulf of Maine.
2.1.4.2 How/by whom are source data updated? Are future updates likely?
Moe Nelson david.moe.nelson@noaa.gov
[likelihood of source data updates requires judgement, enter by hand]
2.2 Indicator analysis/testing or history of use
2.2.1 What decision or advice processes are the indicators currently used in?
Alexandrium cysts in sediments of the Gulf of Maine have been monitored through a cooperative effort of NOAA, WHOI, and other partners for over twenty years. Sampling methods are described in Anderson et al. 2005 [6]. In the annual survey cruises, samples are obtained with a Craib corer, and Alexandrium cysts are counted from the top 1- cm of sediment layer. Results are extrapolated to estimate overall cyst abundance in the eastern, western, and entire Gulf of Maine.
2.2.2 What implications of the indicators are currently listed?
The annual fall surveys of Alexandrium cyst distribution and abundance in the Gulf of Maine provide data needed to predict bloom events in the following year. Other key variables in the predictive models include currents, nutrients, temperature, and salinity dynamics at multiple spatial and temporal scales [7]. After strong cyst deposition events in 2005 and 2009, the time series suggest lower overall cyst abundance through 2023. The cyst abundance in the 2023 survey was relatively low, and a low to moderate bloom year was predicted for 2024 (Li et al. 2024). Bloom events and shellfishery closures usually occur somewhere in any given year. Economic impacts to inshore shellfisheries (mussels, softshell clams, quahogs) can be substantial [8]. Impacts to offshore shellfisheries can occur as well, for example surf clam and ocean quahog on Georges Bank 1988-1990 [9].
2.2.4 Have the indicators been tested to ensure they respond proportionally to a change in the underlying process?
No
3 SMART rating
Category | Indicator | Element | Attribute | Rating | ElementRating | OverallRating |
|---|---|---|---|---|---|---|
Habitat-Living | Harmful Algal Blooms | Specific | Described | 1.0 | 0.5000000 | 0.55 |
Habitat-Living | Harmful Algal Blooms | Specific | Units | 0.0 | 0.5000000 | 0.55 |
Habitat-Living | Harmful Algal Blooms | Specific | Spatial | 1.0 | 0.5000000 | 0.55 |
Habitat-Living | Harmful Algal Blooms | Specific | Uncertainty | 0.0 | 0.5000000 | 0.55 |
Habitat-Living | Harmful Algal Blooms | Specific | Methods | 1.0 | 0.5000000 | 0.55 |
Habitat-Living | Harmful Algal Blooms | Specific | Code | 0.0 | 0.5000000 | 0.55 |
Habitat-Living | Harmful Algal Blooms | Measurable | Available | 1.0 | 0.8333333 | 0.55 |
Habitat-Living | Harmful Algal Blooms | Measurable | Online | 1.0 | 0.8333333 | 0.55 |
Habitat-Living | Harmful Algal Blooms | Measurable | Contact | 1.0 | 0.8333333 | 0.55 |
Habitat-Living | Harmful Algal Blooms | Measurable | SourceDat | 0.0 | 0.8333333 | 0.55 |
Habitat-Living | Harmful Algal Blooms | Measurable | SourceAvail | 1.0 | 0.8333333 | 0.55 |
Habitat-Living | Harmful Algal Blooms | Measurable | SourceContact | 1.0 | 0.8333333 | 0.55 |
Habitat-Living | Harmful Algal Blooms | Achievable | Tested | 0.0 | 0.0000000 | 0.55 |
Habitat-Living | Harmful Algal Blooms | Achievable | Sensitivity | 0.0 | 0.0000000 | 0.55 |
Habitat-Living | Harmful Algal Blooms | Achievable | TimeLag | 0.0 | 0.0000000 | 0.55 |
Habitat-Living | Harmful Algal Blooms | Relevant | Advice | 1.0 | 0.6666667 | 0.55 |
Habitat-Living | Harmful Algal Blooms | Relevant | Implications | 1.0 | 0.6666667 | 0.55 |
Habitat-Living | Harmful Algal Blooms | Relevant | TargThresh | 0.0 | 0.6666667 | 0.55 |
Habitat-Living | Harmful Algal Blooms | Timebound | Frequency | 1.0 | 0.7500000 | 0.55 |
Habitat-Living | Harmful Algal Blooms | Timebound | Updated | 0.5 | 0.7500000 | 0.55 |
3.1 Comments
[Fill below by hand once above data complete]
3.1.1 Additional potential links to management in addition to uses listed above
3.1.2 What additional work would be needed for the Council to use the indicator?
3.1.3 What issues are caused if there is a gap or delay in data underlying the indicator