SMART Indicator Report: Harbor Porpoise Bycatch
1 Descriptive Section
1.2 Indicator name
Harbor Porpoise Bycatch
Includes variable(s): pbr, total5yLCI, total5yUCI, totalest1y, totalest5y
1.3 Indicator brief description
The data presented here are a time series of estimates of harbor porpoise bycatch from U.S. North Atlantic commercial fisheries.
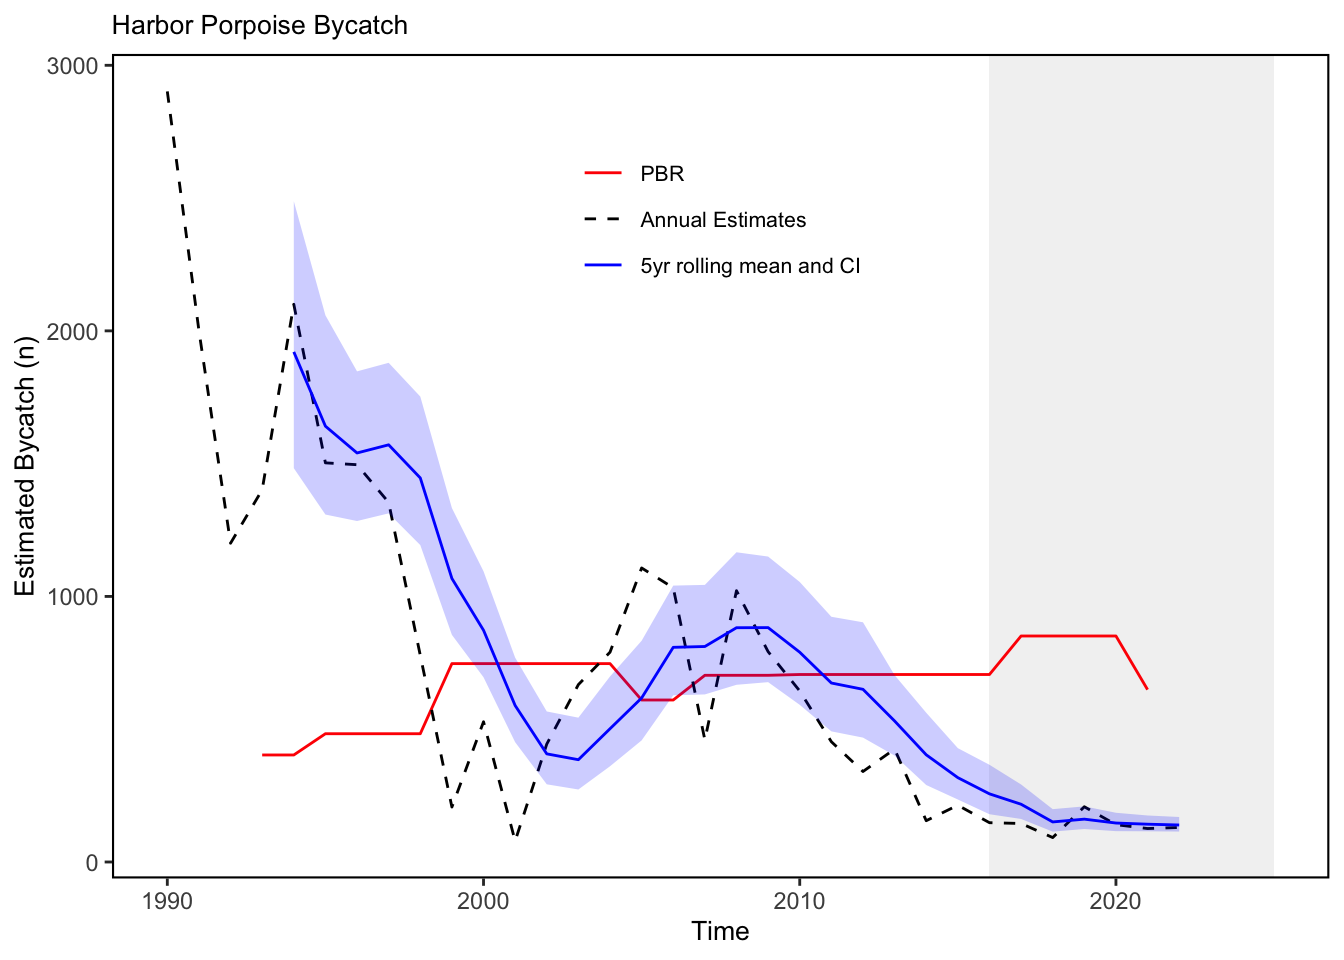
1.4 Indicator visualization
The total estimated bycatch from all U.S. North Atlantic commercial fisheries is plotted by year. In 2022, a total of 133 harbor porpoise were estimated to have been bycaught from 6 fisheries (including bottom gillnets, drift gillnets, bottom trawls, midwater trawls, pair trawls, and pelagic longline). Harbor porpoise bycatch estimates have been below PBR thresholds since 2010, thus meeting current management objectives. Earlier, however, bycatch was above PBR.
2 SMART Attribute Section
2.1 Indicator documentation
2.1.1 Are indicators available for others to use (data downloadable)?
Yes
2.1.1.1 Where can indicators be found?
Data: https://noaa-edab.github.io/ecodata/index.html
Description: https://noaa-edab.github.io/catalog/harborporpoise.html
Technical documentation: https://noaa-edab.github.io/tech-doc/harborporpoise.html
2.1.1.2 How often are they updated? Are future updates likely?
[need sequential look at datasets for update frequency. Future requires judgement]
2.1.1.3 Who is the contact?
Debra Palka (debra.palka@noaa.gov); Kristin Precoda (kristin.precoda@noaa.gov)
2.1.2 Gather indicator statistics
2.1.2.1 Units
Indicator | Units |
|---|---|
pbr | no Units field |
total5yLCI | no Units field |
total5yUCI | no Units field |
totalest1y | no Units field |
totalest5y | no Units field |
2.1.2.2 Length of time series, start and end date, periodicity
General overview: Annual from 1990 to 2023.
Indicator specifics:
Indicator | EPU | StartYear | EndYear | NumYears | MissingYears |
|---|---|---|---|---|---|
pbr | All | 1993 | 2021 | 29 | 0 |
total5yLCI | All | 1994 | 2022 | 29 | 0 |
total5yUCI | All | 1994 | 2022 | 29 | 0 |
totalest1y | All | 1990 | 2022 | 33 | 0 |
totalest5y | All | 1994 | 2022 | 29 | 0 |
2.1.2.3 Spatial location, scale and extent
General overview: US waters from North Carolina to Canada, from the U.S. coastline to the U.S. exclusive economic zone 200 nautical miles offshore, thus including all EPUs, the full shelf and beyond.
Indicator specifics:
Indicator | EPU |
|---|---|
pbr | All |
total5yLCI | All |
total5yUCI | All |
totalest1y | All |
totalest5y | All |
2.1.3 Are methods clearly documented to obtain source data and calculate indicators?
Yes
2.1.3.1 Can the indicator be calculated from current documentation?
Annual and 5-year averaged bycatch estimates are documented in Center Reference Documents (CRD). The potential biological removal values are extracted from the Stock Assessment Reports.
Bycatch estimates and their associated coefficients of variation are documented in the CRDs, then reported in the Marine Mammal Stock Assessment Reports. Annual estimates from all fisheries as reported in the Marine Mammal Stock Assessment Reports are summed together and the CV of the sum is calculated using the delta method. The 95% confidence intervals are then calculated from the sums and associated CVs assuming a lognormal distribution. (\(\sigma = \mu CV\); \(CI = \bar{x} \pm \sigma * 1.96\)).
2.1.4 Are indicator underlying source data linked or easy to find?
Source data are available in public stock assessment reports.
2.1.4.1 Where are source data stored?
Bycatch estimates and potential biological removal levels are reported in the publicly available Marine Mammal Stock Assessment reports. More descriptions on data sources, processing and analyses are found in Northeast Fisheries Science Center (NEFSC) Center Reference Documents (CRDs) and journal papers. The data to calculate the bycatch estimate comes from observer program databases and fishing effort databases.
2.1.4.2 How/by whom are source data updated? Are future updates likely?
Debra Palka debra.palka@noaa.gov
[likelihood of source data updates requires judgement, enter by hand]
2.2 Indicator analysis/testing or history of use
2.2.1 What decision or advice processes are the indicators currently used in?
Marine mammals including harbor porpoise are protected under the Marine Mammal Protection Act (MMPA). The goal of the MMPA is to obtain and maintain optimum sustainable populations of marine mammals and to ensure they continue to function as significant elements of marine ecosystems. Protected species management objectives include managing bycatch to remain below potential biological removal (PBR) thresholds, recovering endangered populations, and monitoring unusual mortality events. Here we report estimated bycatch and PBR thresholds for harbor porpoise in the Northeast U.S., which are subject to a Take Reduction Team under the Marine Mammal Protection Act.
2.2.2 What implications of the indicators are currently listed?
A bycatch reduction plan developed by the Take Reduction Team was needed to reduce the bycatch of harbor porpoises starting in 1997 (https://www.fisheries.noaa.gov/new-england-mid-atlantic/marine-mammal-protection/harbor-porpoise-take-reduction-plan; Fig. x). The reduction in harbor porpoise bycatch since 2010 is probably related not only to the Take Reduction Team’s bycatch mitigation plan but also to a corresponding decrease in gillnet fishing effort and to seasonal shifts of harbor porpoise that appear to be related to climate changes.
2.2.3 Do target, limit, or threshold values already exist for the indicator?
Target, limit, or threshold terms detected
2.2.4 Have the indicators been tested to ensure they respond proportionally to a change in the underlying process?
No
3 SMART rating
Category | Indicator | Element | Attribute | Rating | ElementRating | OverallRating |
|---|---|---|---|---|---|---|
Protected | Harbor Porpoise Bycatch | Specific | Described | 1.0 | 0.6666667 | 0.6833333 |
Protected | Harbor Porpoise Bycatch | Specific | Units | 0.0 | 0.6666667 | 0.6833333 |
Protected | Harbor Porpoise Bycatch | Specific | Spatial | 1.0 | 0.6666667 | 0.6833333 |
Protected | Harbor Porpoise Bycatch | Specific | Uncertainty | 1.0 | 0.6666667 | 0.6833333 |
Protected | Harbor Porpoise Bycatch | Specific | Methods | 1.0 | 0.6666667 | 0.6833333 |
Protected | Harbor Porpoise Bycatch | Specific | Code | 0.0 | 0.6666667 | 0.6833333 |
Protected | Harbor Porpoise Bycatch | Measurable | Available | 1.0 | 1.0000000 | 0.6833333 |
Protected | Harbor Porpoise Bycatch | Measurable | Online | 1.0 | 1.0000000 | 0.6833333 |
Protected | Harbor Porpoise Bycatch | Measurable | Contact | 1.0 | 1.0000000 | 0.6833333 |
Protected | Harbor Porpoise Bycatch | Measurable | SourceDat | 1.0 | 1.0000000 | 0.6833333 |
Protected | Harbor Porpoise Bycatch | Measurable | SourceAvail | 1.0 | 1.0000000 | 0.6833333 |
Protected | Harbor Porpoise Bycatch | Measurable | SourceContact | 1.0 | 1.0000000 | 0.6833333 |
Protected | Harbor Porpoise Bycatch | Achievable | Tested | 0.0 | 0.0000000 | 0.6833333 |
Protected | Harbor Porpoise Bycatch | Achievable | Sensitivity | 0.0 | 0.0000000 | 0.6833333 |
Protected | Harbor Porpoise Bycatch | Achievable | TimeLag | 0.0 | 0.0000000 | 0.6833333 |
Protected | Harbor Porpoise Bycatch | Relevant | Advice | 1.0 | 1.0000000 | 0.6833333 |
Protected | Harbor Porpoise Bycatch | Relevant | Implications | 1.0 | 1.0000000 | 0.6833333 |
Protected | Harbor Porpoise Bycatch | Relevant | TargThresh | 1.0 | 1.0000000 | 0.6833333 |
Protected | Harbor Porpoise Bycatch | Timebound | Frequency | 1.0 | 0.7500000 | 0.6833333 |
Protected | Harbor Porpoise Bycatch | Timebound | Updated | 0.5 | 0.7500000 | 0.6833333 |
3.1 Comments
[Fill below by hand once above data complete]
3.1.1 Additional potential links to management in addition to uses listed above
3.1.2 What additional work would be needed for the Council to use the indicator?
3.1.3 What issues are caused if there is a gap or delay in data underlying the indicator