SMART Indicator Report: Forage Fish Index
1 Descriptive Section
1.2 Indicator name
Forage Fish Index
Includes variable(s): Fall Eastward Forage Fish Center of Gravity, Fall Eastward Forage Fish Center of Gravity SE, Fall Forage Fish Biomass Estimate, Fall Forage Fish Biomass Estimate SE, Fall Northward Forage Fish Center of Gravity, Fall Northward Forage Fish Center of Gravity SE, Spring Eastward Forage Fish Center of Gravity, Spring Eastward Forage Fish Center of Gravity SE, Spring Forage Fish Biomass Estimate, Spring Forage Fish Biomass Estimate SE, Spring Northward Forage Fish Center of Gravity, Spring Northward Forage Fish Center of Gravity SE
1.4 Indicator visualization
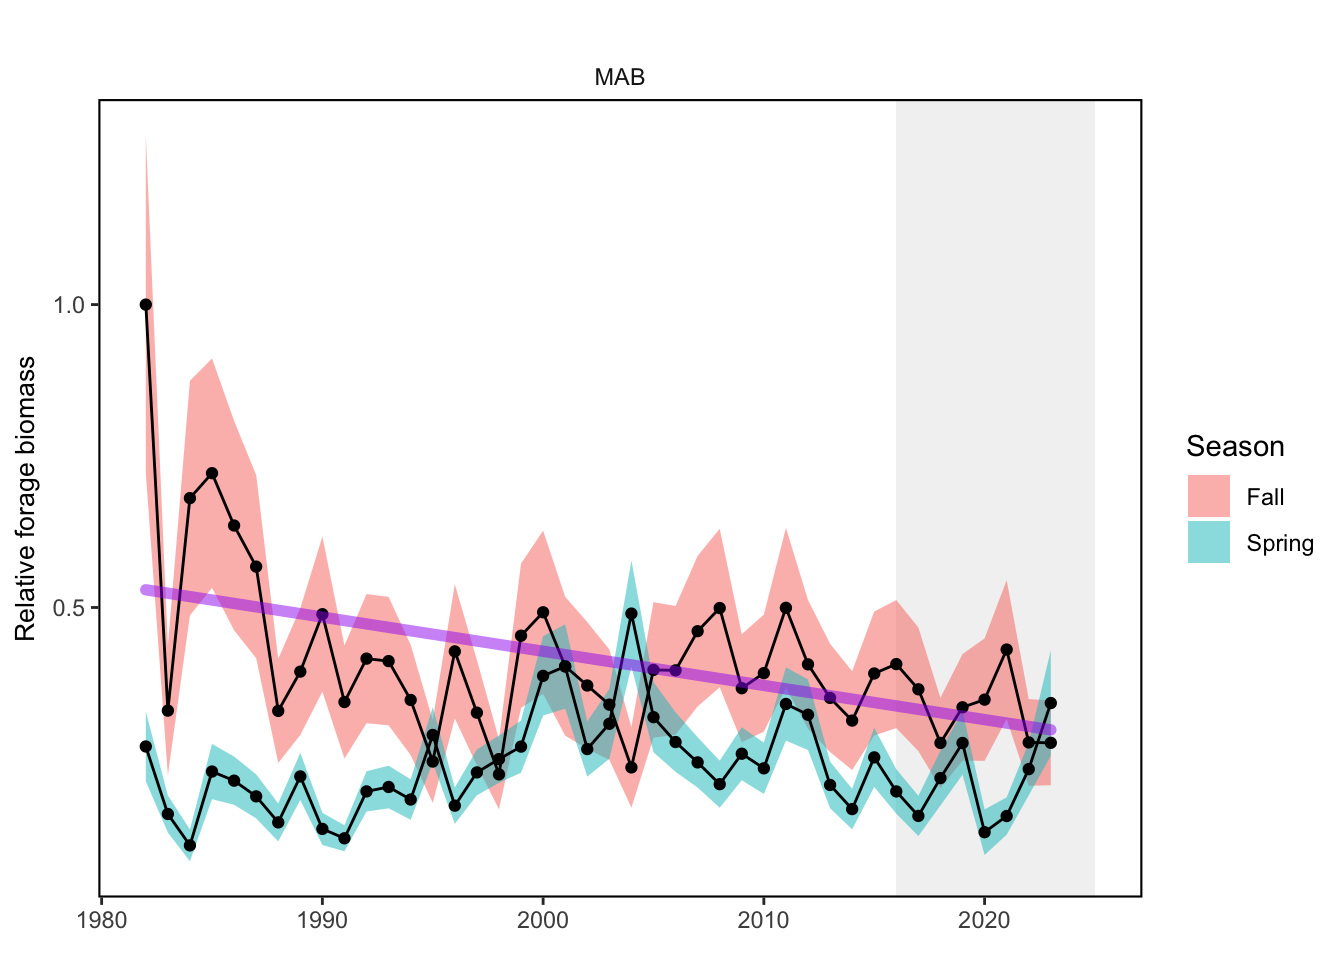
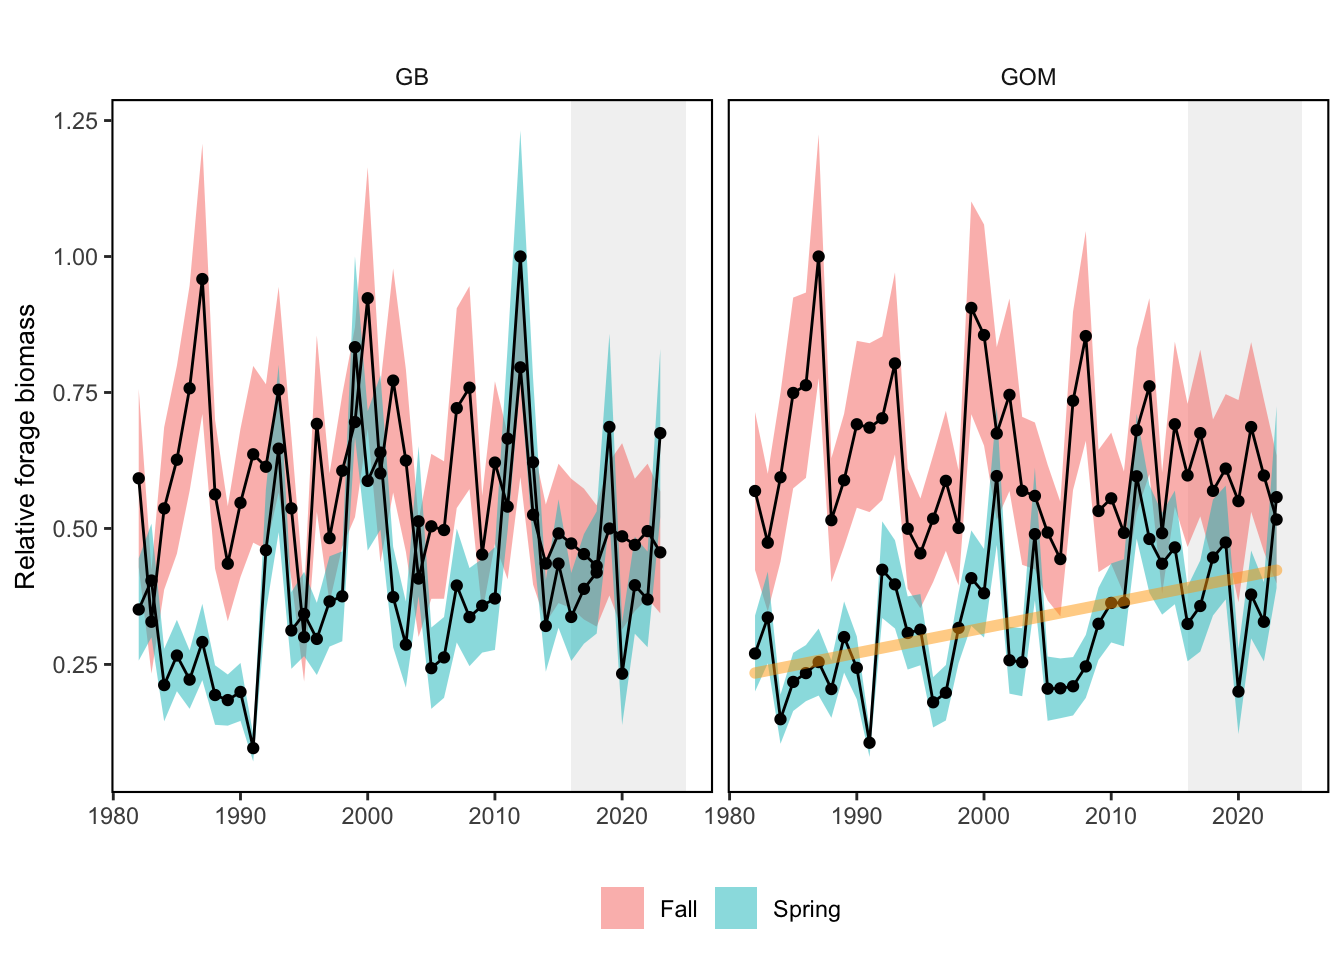
Variables plotted are Fall Forage Fish Biomass Estimate and Spring Forage Fish Biomass Estimate with error bands from Fall Forage Fish Biomass Estimate SE and Spring Forage Fish Biomass Estimate SE, respectively. Time series were extended back to 1982 and forward to 2023 in this update, but this did not change the trends reported previously for 1982-2022.

2 SMART Attribute Section
2.1 Indicator documentation
2.1.1 Are indicators available for others to use (data downloadable)?
Yes
2.1.1.1 Where can indicators be found?
Data: https://noaa-edab.github.io/ecodata/index.html
Description: https://noaa-edab.github.io/catalog/forage_index.html
Technical documentation: https://noaa-edab.github.io/tech-doc/forage_index.html
2.1.1.2 How often are they updated? Are future updates likely?
[need sequential look at datasets for update frequency. Future requires judgement]
2.1.1.3 Who is the contact?
Sarah Gaichas (Sarah.Gaichas@noaa.gov)
2.1.2 Gather indicator statistics
2.1.2.1 Units
Indicator | Units |
|---|---|
Fall Eastward Forage Fish Center of Gravity | km |
Fall Eastward Forage Fish Center of Gravity SE | km |
Fall Forage Fish Biomass Estimate | relative grams per stomach |
Fall Forage Fish Biomass Estimate SE | relative grams per stomach |
Fall Northward Forage Fish Center of Gravity | km |
Fall Northward Forage Fish Center of Gravity SE | km |
Spring Eastward Forage Fish Center of Gravity | km |
Spring Eastward Forage Fish Center of Gravity SE | km |
Spring Forage Fish Biomass Estimate | relative grams per stomach |
Spring Forage Fish Biomass Estimate SE | relative grams per stomach |
Spring Northward Forage Fish Center of Gravity | km |
Spring Northward Forage Fish Center of Gravity SE | km |
2.1.2.2 Length of time series, start and end date, periodicity
General overview: Spring (January-June), Fall (July-December)
Indicator specifics:
Indicator | EPU | StartYear | EndYear | NumYears | MissingYears |
|---|---|---|---|---|---|
Fall Eastward Forage Fish Center of Gravity | ALLEPU | 1982 | 2023 | 42 | 0 |
Fall Eastward Forage Fish Center of Gravity SE | ALLEPU | 1982 | 2023 | 42 | 0 |
Fall Forage Fish Biomass Estimate | AllEPU | 1982 | 2023 | 42 | 0 |
Fall Forage Fish Biomass Estimate | GB | 1982 | 2023 | 42 | 0 |
Fall Forage Fish Biomass Estimate | GOM | 1982 | 2023 | 42 | 0 |
Fall Forage Fish Biomass Estimate | MAB | 1982 | 2023 | 42 | 0 |
Fall Forage Fish Biomass Estimate SE | AllEPU | 1982 | 2023 | 42 | 0 |
Fall Forage Fish Biomass Estimate SE | GB | 1982 | 2023 | 42 | 0 |
Fall Forage Fish Biomass Estimate SE | GOM | 1982 | 2023 | 42 | 0 |
Fall Forage Fish Biomass Estimate SE | MAB | 1982 | 2023 | 42 | 0 |
Fall Northward Forage Fish Center of Gravity | ALLEPU | 1982 | 2023 | 42 | 0 |
Fall Northward Forage Fish Center of Gravity SE | ALLEPU | 1982 | 2023 | 42 | 0 |
Spring Eastward Forage Fish Center of Gravity | ALLEPU | 1982 | 2023 | 42 | 0 |
Spring Eastward Forage Fish Center of Gravity SE | ALLEPU | 1982 | 2023 | 42 | 0 |
Spring Forage Fish Biomass Estimate | AllEPU | 1982 | 2023 | 42 | 0 |
Spring Forage Fish Biomass Estimate | GB | 1982 | 2023 | 42 | 0 |
Spring Forage Fish Biomass Estimate | GOM | 1982 | 2023 | 42 | 0 |
Spring Forage Fish Biomass Estimate | MAB | 1982 | 2023 | 42 | 0 |
Spring Forage Fish Biomass Estimate SE | AllEPU | 1982 | 2023 | 42 | 0 |
Spring Forage Fish Biomass Estimate SE | GB | 1982 | 2023 | 42 | 0 |
Spring Forage Fish Biomass Estimate SE | GOM | 1982 | 2023 | 42 | 0 |
Spring Forage Fish Biomass Estimate SE | MAB | 1982 | 2023 | 42 | 0 |
Spring Northward Forage Fish Center of Gravity | ALLEPU | 1982 | 2023 | 42 | 0 |
Spring Northward Forage Fish Center of Gravity SE | ALLEPU | 1982 | 2023 | 42 | 0 |
2.1.2.3 Spatial location, scale and extent
General overview: by EPU and full shelf
Indicator specifics:
Indicator | EPU |
|---|---|
Fall Eastward Forage Fish Center of Gravity | ALLEPU |
Fall Eastward Forage Fish Center of Gravity SE | ALLEPU |
Fall Forage Fish Biomass Estimate | AllEPU |
Fall Forage Fish Biomass Estimate | GB |
Fall Forage Fish Biomass Estimate | GOM |
Fall Forage Fish Biomass Estimate | MAB |
Fall Forage Fish Biomass Estimate SE | AllEPU |
Fall Forage Fish Biomass Estimate SE | GB |
Fall Forage Fish Biomass Estimate SE | GOM |
Fall Forage Fish Biomass Estimate SE | MAB |
Fall Northward Forage Fish Center of Gravity | ALLEPU |
Fall Northward Forage Fish Center of Gravity SE | ALLEPU |
Spring Eastward Forage Fish Center of Gravity | ALLEPU |
Spring Eastward Forage Fish Center of Gravity SE | ALLEPU |
Spring Forage Fish Biomass Estimate | AllEPU |
Spring Forage Fish Biomass Estimate | GB |
Spring Forage Fish Biomass Estimate | GOM |
Spring Forage Fish Biomass Estimate | MAB |
Spring Forage Fish Biomass Estimate SE | AllEPU |
Spring Forage Fish Biomass Estimate SE | GB |
Spring Forage Fish Biomass Estimate SE | GOM |
Spring Forage Fish Biomass Estimate SE | MAB |
Spring Northward Forage Fish Center of Gravity | ALLEPU |
Spring Northward Forage Fish Center of Gravity SE | ALLEPU |
2.1.2.4 Management scale: all species, FMP level, species level, can it be aggregated or separated to different scales?
[Classify by hand, note gridded data if available could be applied to different species ranges]
2.1.2.5 Uncertainty metrics
Uncertainty is captured in these variables:
[1] “Fall Eastward Forage Fish Center of Gravity SE” “Fall Forage Fish Biomass Estimate SE”
[3] “Fall Northward Forage Fish Center of Gravity SE” “Spring Eastward Forage Fish Center of Gravity SE”
[5] “Spring Forage Fish Biomass Estimate SE” “Spring Northward Forage Fish Center of Gravity SE”
2.1.3 Are methods clearly documented to obtain source data and calculate indicators?
Yes
2.1.3.1 Can the indicator be calculated from current documentation?
NEFSC survey diet data were extracted and provided by Brian Smith (NEFSC). NEAMAP survey diet data were extracted and processed by James Gartland (VIMS). Code to extract the OISST information was modified from code kindly provided by Kim Bastille pulling daily gridded SST for each year 1985-2021 using her code starting line 260, as well as Kim’s nc_to_raster function for NEUS shelf from at this link. The full OISST extraction script is available at this link with visualizations of survey in-situ temperatures compared with OISST at this link
The steps involved to estimate the forage index included defining the input dataset, and running multiple configurations of the VAST model. Steps involved in defining the dataset included defining “bluefish prey”, defining a set of piscivore predators with similar diets to bluefish, integrating diet data from two regional surveys, and integrating supplementary SST data to fill gaps in in-situ temperature data measurements. Steps involved in running the VAST model included decisions on spatial footprint, model structure, model selection to determine if spatial and spatio-temporal random effects were supported by the data, and further model selection to determine which catchability covariates were best supported by the data. Finally, subsets of the spatial domain were defined to match bluefish assessment inputs (survey and recreational fishery CPUE) for potential use as covariates in bluefish stock assessment models, and a bias-corrected (James T. Thorson and Kristensen 2016) forage index for each spatial subset was generated.
2.1.4 Are indicator underlying source data linked or easy to find?
Source data are publicly available. All data and code available on GitHub at https://github.com/NOAA-EDAB/forageindex
2.1.4.1 Where are source data stored?
Data used to develop this indicator comes from multispecies diet data collected on the Northeast Fisheries Science Center (NEFSC) and NorthEast Area Monitoring and Assessment Program (NEAMAP) bottom trawl surveys. Sea Surface Temperature (SST) data were used from in situ NEFSC and NEAMAP survey in-situ collections, as well as NOAA High Resolution SST data (Optimal Interpolation Sea Surface Temperature- OISST, Reynolds et al. (2007)), provided by the NOAA/OAR/ESRL PSL, Boulder, Colorado, USA, from their Web site at https://psl.noaa.gov/data/gridded/data.noaa.oisst.v2.highres.html. This is the same source data used in seasonal SST anomaly analyses.
2.1.4.2 How/by whom are source data updated? Are future updates likely?
Sarah Gaichas, Sarah.Gaichas@noaa.gov
[likelihood of source data updates requires judgement, enter by hand]
2.2 Indicator analysis/testing or history of use
2.2.1 What decision or advice processes are the indicators currently used in?
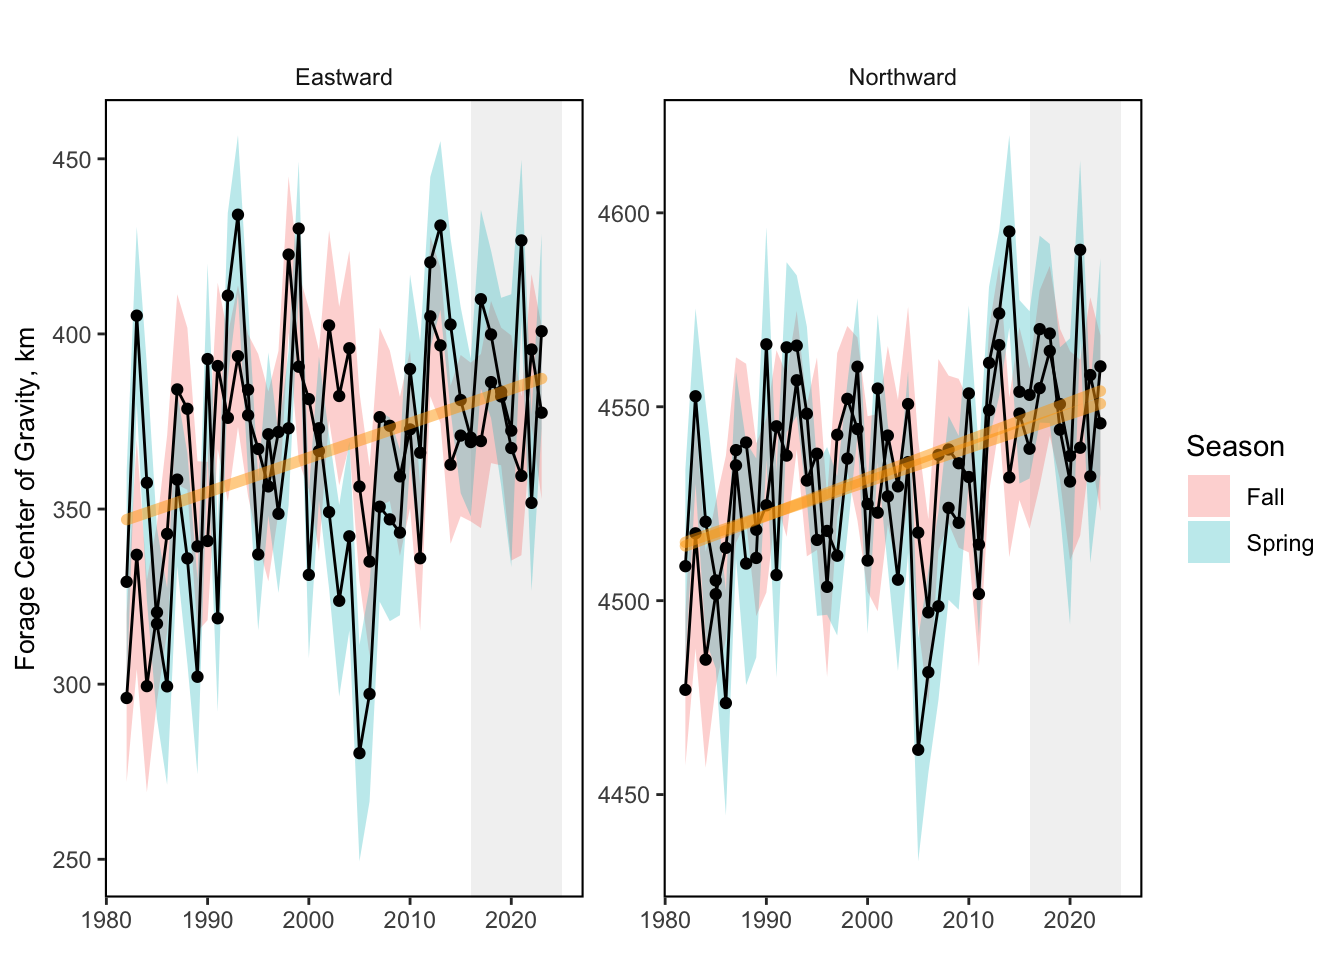
The amount of forage fish available in the ecosystem combined with the energy content of the forage species determines the amount of energy potentially available to predators in the ecosystem. Changes in the forage base could pose a risk to managed and protected species production. Spatially explicit indices of abundance for several forage species were estimated using spatio-temporal modeling (VAST, [10]; [11]). This spatially-explicit forage index estimated the combined biomass of 21 forage species using stomach contents information from 22 predatory fish species collected on bottom trawl surveys. In addition to an index of forage abundance in each EPU, the coastwide center of gravity for the combined forage biomass was estimated. Consistent movement of the center of gravity towards the north or east indicates a distribution shift for combined forage fish.
2.2.2 What implications of the indicators are currently listed?
The resulting indices for the Mid-Atlantic show a long term decrease in fall and overall higher forage fish in fall relative to spring, with highest forage biomass during fall in the early-1980s. In New England, the forage index shows an overall higher forage fish biomass in fall relative to spring. There is a long-term increasing trend in the spring in GOM. Changes in the distribution of forage biomass also affects predator distribution. Since 1982, the fall center of gravity of forage fish has moved to the north and east. The spring forage center of gravity shows higher variability than fall, and a significant trend to the north.
2.2.4 Have the indicators been tested to ensure they respond proportionally to a change in the underlying process?
No
3 SMART rating
Category | Indicator | Element | Attribute | Rating | ElementRating | OverallRating |
|---|---|---|---|---|---|---|
Fish | Forage Fish Index | Specific | Described | 1.0 | 1.0000000 | 0.6833333 |
Fish | Forage Fish Index | Specific | Units | 1.0 | 1.0000000 | 0.6833333 |
Fish | Forage Fish Index | Specific | Spatial | 1.0 | 1.0000000 | 0.6833333 |
Fish | Forage Fish Index | Specific | Uncertainty | 1.0 | 1.0000000 | 0.6833333 |
Fish | Forage Fish Index | Specific | Methods | 1.0 | 1.0000000 | 0.6833333 |
Fish | Forage Fish Index | Specific | Code | 1.0 | 1.0000000 | 0.6833333 |
Fish | Forage Fish Index | Measurable | Available | 1.0 | 1.0000000 | 0.6833333 |
Fish | Forage Fish Index | Measurable | Online | 1.0 | 1.0000000 | 0.6833333 |
Fish | Forage Fish Index | Measurable | Contact | 1.0 | 1.0000000 | 0.6833333 |
Fish | Forage Fish Index | Measurable | SourceDat | 1.0 | 1.0000000 | 0.6833333 |
Fish | Forage Fish Index | Measurable | SourceAvail | 1.0 | 1.0000000 | 0.6833333 |
Fish | Forage Fish Index | Measurable | SourceContact | 1.0 | 1.0000000 | 0.6833333 |
Fish | Forage Fish Index | Achievable | Tested | 0.0 | 0.0000000 | 0.6833333 |
Fish | Forage Fish Index | Achievable | Sensitivity | 0.0 | 0.0000000 | 0.6833333 |
Fish | Forage Fish Index | Achievable | TimeLag | 0.0 | 0.0000000 | 0.6833333 |
Fish | Forage Fish Index | Relevant | Advice | 1.0 | 0.6666667 | 0.6833333 |
Fish | Forage Fish Index | Relevant | Implications | 1.0 | 0.6666667 | 0.6833333 |
Fish | Forage Fish Index | Relevant | TargThresh | 0.0 | 0.6666667 | 0.6833333 |
Fish | Forage Fish Index | Timebound | Frequency | 1.0 | 0.7500000 | 0.6833333 |
Fish | Forage Fish Index | Timebound | Updated | 0.5 | 0.7500000 | 0.6833333 |
3.1 Comments
[Fill below by hand once above data complete]
3.1.1 Additional potential links to management in addition to uses listed above
3.1.2 What additional work would be needed for the Council to use the indicator?
3.1.3 What issues are caused if there is a gap or delay in data underlying the indicator