SMART Indicator Report: Community Port Landings and Revenue from Wind Energy Areas (WEAs)
1 Descriptive Section
1.2 Indicator name
Community Port Landings and Revenue from Wind Energy Areas (WEAs)
Includes variable(s): perc_MIN, perc_MAX, EJ, Gentrification, MaxVal
1.4 Indicator visualization
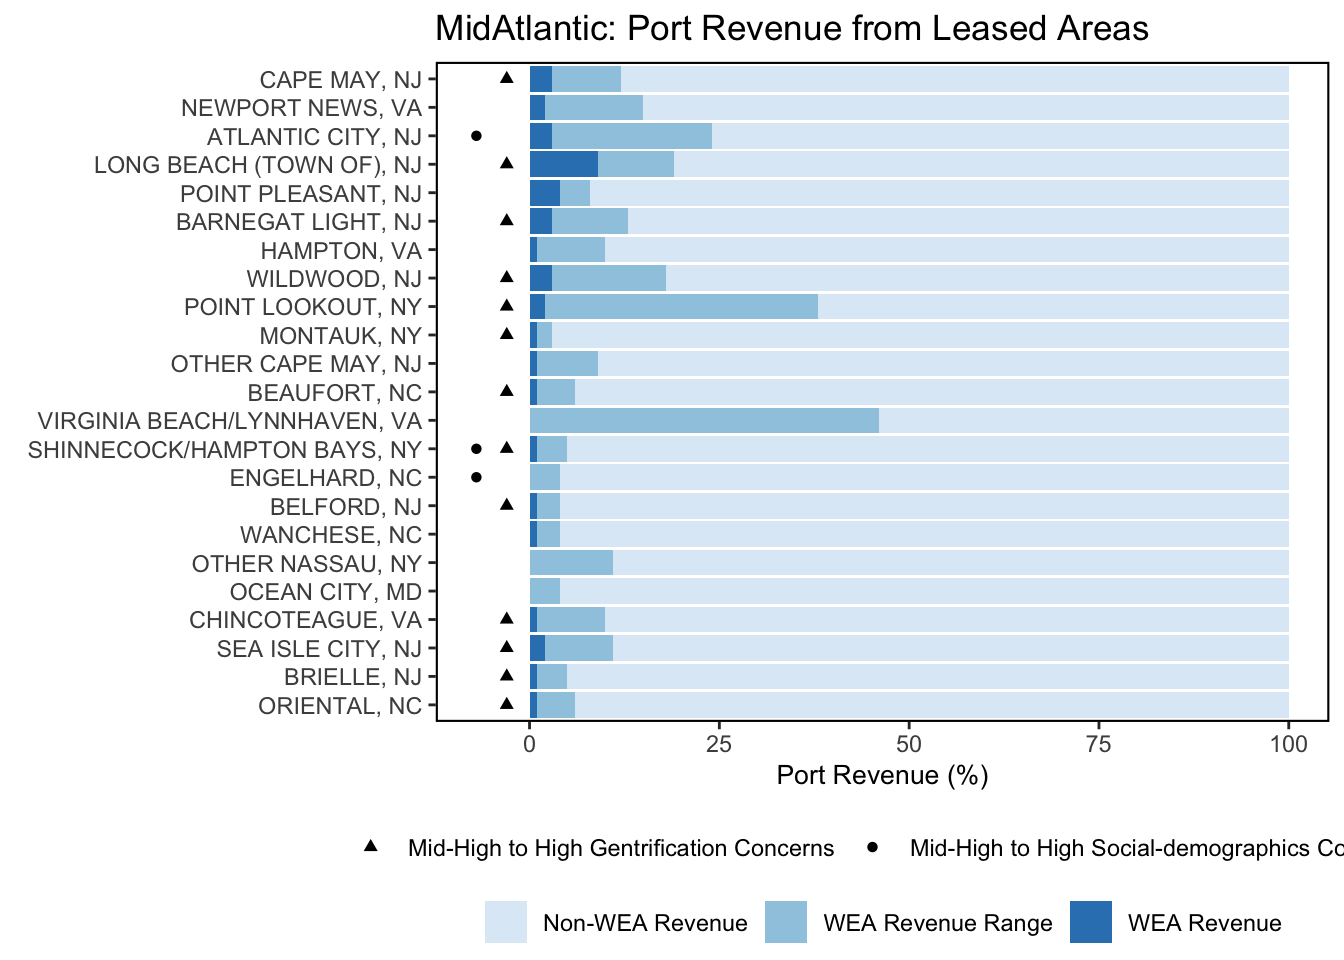
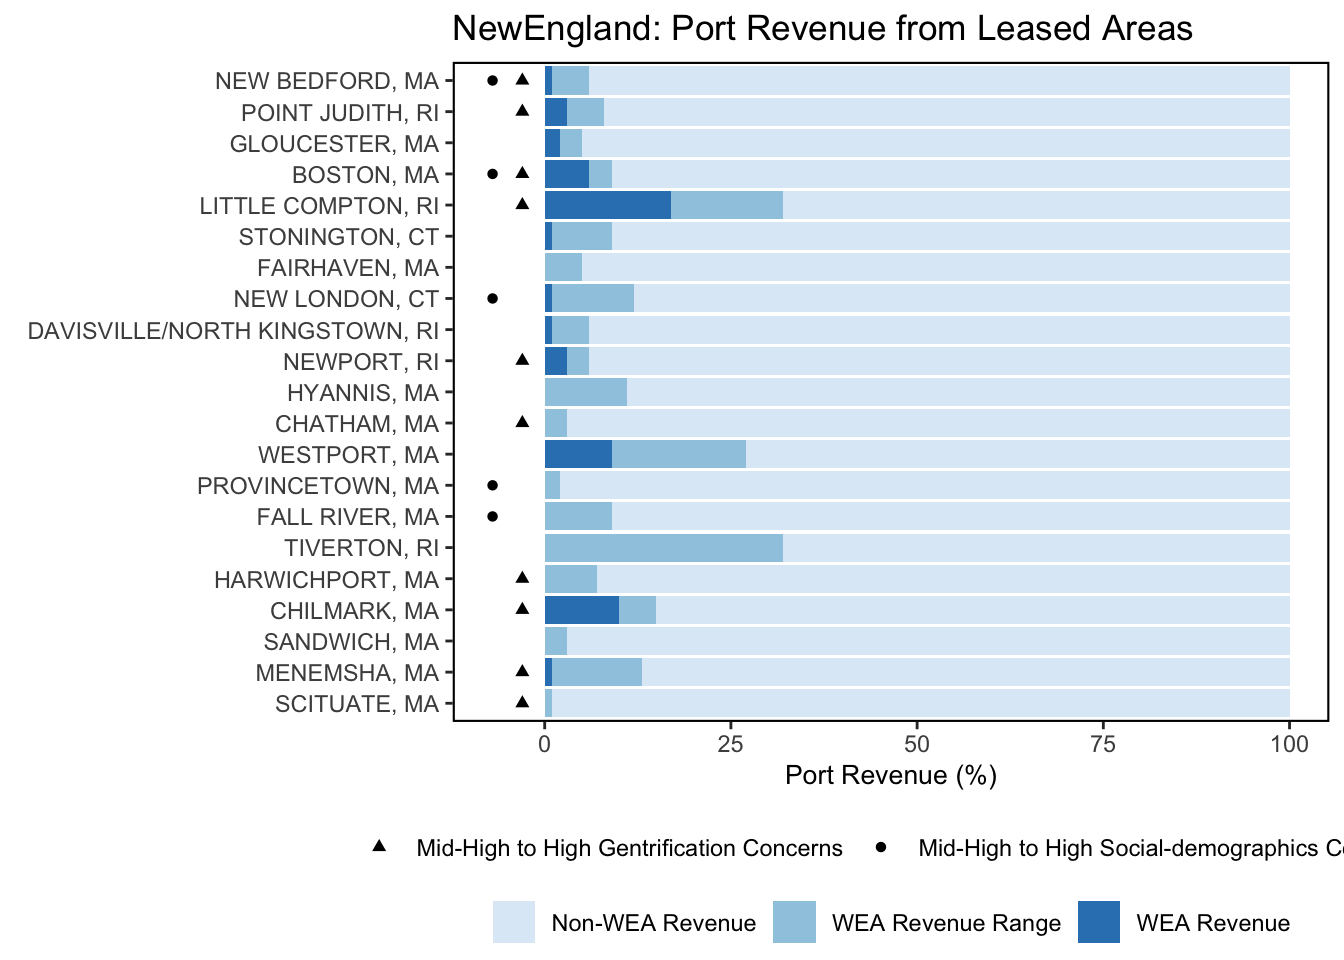
This figure links historic port revenue (2008-2022) from within all wind energy areas (including all lease areas, the Central Atlantic proposed lease areas A-2, B-1 and C-1, GOM Draft Wind Energy Area and secondary areas), as a proportion of a port’s total fisheries revenue based on vessel trip reports as described in the revenue and landings of species in the wind indicator above. The range (minimum and maximum) of total percent fisheries revenue from within wind energy areas is presented in the graph and ports are sorted from greatest to least fisheries revenue from within wind areas. Those communities that score Med-High or higher in at least one of the vulnerability indicators that address social vulnerability concerns (i.e., Poverty, Population Composition, Personal Disruption; see indicator definitions) are noted with a triangle. Gentrification pressure is also highlighted here, with those communities that score Med-High or higher in one or more gentrification pressure indicators (i.e., Housing Disruption, Retiree Migration, Urban Sprawl) represented with a circle.
2 SMART Attribute Section
2.1 Indicator documentation
2.1.1 Are indicators available for others to use (data downloadable)?
Yes
2.1.1.1 Where can indicators be found?
Data: https://noaa-edab.github.io/ecodata/index.html
Description: https://noaa-edab.github.io/catalog/wind_port.html
Technical documentation: https://noaa-edab.github.io/tech-doc/wind_port.html
2.1.1.2 How often are they updated? Are future updates likely?
[need sequential look at datasets for update frequency. Future requires judgement]
2.1.1.3 Who is the contact?
Angela Silva (angela.silva@noaa.gov)
2.1.2 Gather indicator statistics
2.1.2.1 Units
Indicator | Units |
|---|---|
perc_MIN | no Units field |
perc_MAX | no Units field |
EJ | no Units field |
Gentrification | no Units field |
MaxVal | no Units field |
2.1.2.2 Length of time series, start and end date, periodicity
General overview: 2008-2022
Indicator specifics:
Indicator | Varname |
|---|---|
perc_MIN | no Time Variables |
perc_MAX | no Time Variables |
EJ | no Time Variables |
Gentrification | no Time Variables |
MaxVal | no Time Variables |
2.1.2.3 Spatial location, scale and extent
General overview: Full Shelf, broken down into Mid-Atlantic and New England communities
Indicator specifics:
Indicator | EPU |
|---|---|
perc_MIN | NE |
perc_MIN | MAB |
perc_MIN | |
perc_MAX | NE |
perc_MAX | MAB |
perc_MAX | |
EJ | NE |
EJ | MAB |
EJ | |
Gentrification | NE |
Gentrification | MAB |
Gentrification | |
MaxVal | NE |
MaxVal | MAB |
MaxVal |
2.1.3 Are methods clearly documented to obtain source data and calculate indicators?
Yes
2.1.3.1 Can the indicator be calculated from current documentation?
Cumulative port landings(pounds) and revenue(dollars) from Wind Energy Areas (WEA) were pulled for communities along the Northeast US Shelf from 2010 to 2019. Percent of wind lease area landings were calculated compared to total landings for those communities. Social Vulnerability indicators were then matched to these communities.
2.1.4 Are indicator underlying source data linked or easy to find?
Source data are NOT publicly available. Please email angela.silva@noaa.gov for further information and queries of Speed and Extent of Offshore Wind Development indicator source data.
2.1.4.1 Where are source data stored?
Social Indicators Data: https://www.fisheries.noaa.gov/national/socioeconomics/social-indicators-coastal-communities https://www.st.nmfs.noaa.gov/data-and-tools/social-indicators/ Wind Data: https://www.greateratlantic.fisheries.noaa.gov/ro/fso/reports/WIND/ALL_WEA_BY_AREA_DATA.html https://www.fisheries.noaa.gov/resource/data/socioeconomic-impacts-atlantic-offshore-wind-development
2.2 Indicator analysis/testing or history of use
2.2.2 What implications of the indicators are currently listed?
BOEM reports that cumulative offshore wind development (if all proposed projects are developed) could have moderate impacts on low-income members of socially vulnerable communities who work in the commercial fishing and for-hire fishing industry due to disruptions to fish populations, restrictions on navigation and increased vessel traffic as well as existing vulnerabilities of low-income workers to economic impacts [121]. impacts of offshore wind development may unevenly affect individual operators, with permit-based revenue being much higher than the port-based mean for some permit holders
2.2.4 Have the indicators been tested to ensure they respond proportionally to a change in the underlying process?
No
3 SMART rating
Category | Indicator | Element | Attribute | Rating | ElementRating | OverallRating |
|---|---|---|---|---|---|---|
Fishery Economic Social | Community Port Landings and Revenue from Wind Energy Areas (WEAs) | Specific | Described | 1 | 0.5000000 | 0.5 |
Fishery Economic Social | Community Port Landings and Revenue from Wind Energy Areas (WEAs) | Specific | Units | 0 | 0.5000000 | 0.5 |
Fishery Economic Social | Community Port Landings and Revenue from Wind Energy Areas (WEAs) | Specific | Spatial | 1 | 0.5000000 | 0.5 |
Fishery Economic Social | Community Port Landings and Revenue from Wind Energy Areas (WEAs) | Specific | Uncertainty | 0 | 0.5000000 | 0.5 |
Fishery Economic Social | Community Port Landings and Revenue from Wind Energy Areas (WEAs) | Specific | Methods | 1 | 0.5000000 | 0.5 |
Fishery Economic Social | Community Port Landings and Revenue from Wind Energy Areas (WEAs) | Specific | Code | 0 | 0.5000000 | 0.5 |
Fishery Economic Social | Community Port Landings and Revenue from Wind Energy Areas (WEAs) | Measurable | Available | 1 | 0.8333333 | 0.5 |
Fishery Economic Social | Community Port Landings and Revenue from Wind Energy Areas (WEAs) | Measurable | Online | 1 | 0.8333333 | 0.5 |
Fishery Economic Social | Community Port Landings and Revenue from Wind Energy Areas (WEAs) | Measurable | Contact | 1 | 0.8333333 | 0.5 |
Fishery Economic Social | Community Port Landings and Revenue from Wind Energy Areas (WEAs) | Measurable | SourceDat | 0 | 0.8333333 | 0.5 |
Fishery Economic Social | Community Port Landings and Revenue from Wind Energy Areas (WEAs) | Measurable | SourceAvail | 1 | 0.8333333 | 0.5 |
Fishery Economic Social | Community Port Landings and Revenue from Wind Energy Areas (WEAs) | Measurable | SourceContact | 1 | 0.8333333 | 0.5 |
Fishery Economic Social | Community Port Landings and Revenue from Wind Energy Areas (WEAs) | Achievable | Tested | 0 | 0.0000000 | 0.5 |
Fishery Economic Social | Community Port Landings and Revenue from Wind Energy Areas (WEAs) | Achievable | Sensitivity | 0 | 0.0000000 | 0.5 |
Fishery Economic Social | Community Port Landings and Revenue from Wind Energy Areas (WEAs) | Achievable | TimeLag | 0 | 0.0000000 | 0.5 |
Fishery Economic Social | Community Port Landings and Revenue from Wind Energy Areas (WEAs) | Relevant | Advice | 1 | 0.6666667 | 0.5 |
Fishery Economic Social | Community Port Landings and Revenue from Wind Energy Areas (WEAs) | Relevant | Implications | 1 | 0.6666667 | 0.5 |
Fishery Economic Social | Community Port Landings and Revenue from Wind Energy Areas (WEAs) | Relevant | TargThresh | 0 | 0.6666667 | 0.5 |
Fishery Economic Social | Community Port Landings and Revenue from Wind Energy Areas (WEAs) | Timebound | Frequency | 1 | 0.5000000 | 0.5 |
Fishery Economic Social | Community Port Landings and Revenue from Wind Energy Areas (WEAs) | Timebound | Updated | 0 | 0.5000000 | 0.5 |
3.1 Comments
[Fill below by hand once above data complete]
3.1.1 Additional potential links to management in addition to uses listed above
3.1.2 What additional work would be needed for the Council to use the indicator?
3.1.3 What issues are caused if there is a gap or delay in data underlying the indicator