SMART Indicator Report: Bottom trawl survey diversity index
1 Descriptive Section
2 SMART Attribute Section
2.1 Indicator documentation
2.1.1 Are indicators available for others to use (data downloadable)?
Yes
2.1.1.1 Where can indicators be found?
Data: https://noaa-edab.github.io/ecodata/index.html
Description: https://noaa-edab.github.io/catalog/survey_shannon.html
Technical documentation: https://noaa-edab.github.io/tech-doc/survey_shannon.html
2.1.1.2 How often are they updated? Are future updates likely?
[need sequential look at datasets for update frequency. Future requires judgement]
2.1.2 Gather indicator statistics
2.1.2.1 Units
Indicator | Units |
|---|---|
NEFSC survey species diversity - FALL | effective Shannon |
NEFSC survey species diversity - SPRING | effective Shannon |
2.1.2.2 Length of time series, start and end date, periodicity
General overview: SPRING, FALL
Indicator specifics:
Indicator | EPU | StartYear | EndYear | NumYears | MissingYears |
|---|---|---|---|---|---|
NEFSC survey species diversity - FALL | GB | 1963 | 2024 | 61 | 1 |
NEFSC survey species diversity - FALL | GOM | 1963 | 2024 | 61 | 1 |
NEFSC survey species diversity - FALL | MAB | 1963 | 2024 | 60 | 2 |
NEFSC survey species diversity - FALL | SS | 1963 | 2024 | 61 | 1 |
NEFSC survey species diversity - SPRING | GB | 1968 | 2024 | 56 | 1 |
NEFSC survey species diversity - SPRING | GOM | 1968 | 2024 | 56 | 1 |
NEFSC survey species diversity - SPRING | MAB | 1968 | 2024 | 56 | 1 |
NEFSC survey species diversity - SPRING | SS | 1968 | 2024 | 56 | 1 |
2.1.2.3 Spatial location, scale and extent
General overview: EPU
Indicator specifics:
Indicator | EPU |
|---|---|
NEFSC survey species diversity - FALL | GB |
NEFSC survey species diversity - FALL | GOM |
NEFSC survey species diversity - FALL | MAB |
NEFSC survey species diversity - FALL | SS |
NEFSC survey species diversity - SPRING | GB |
NEFSC survey species diversity - SPRING | GOM |
NEFSC survey species diversity - SPRING | MAB |
NEFSC survey species diversity - SPRING | SS |
2.1.3 Are methods clearly documented to obtain source data and calculate indicators?
Yes
2.1.3.1 Can the indicator be calculated from current documentation?
The R package survdat was used in the survey data extraction process.
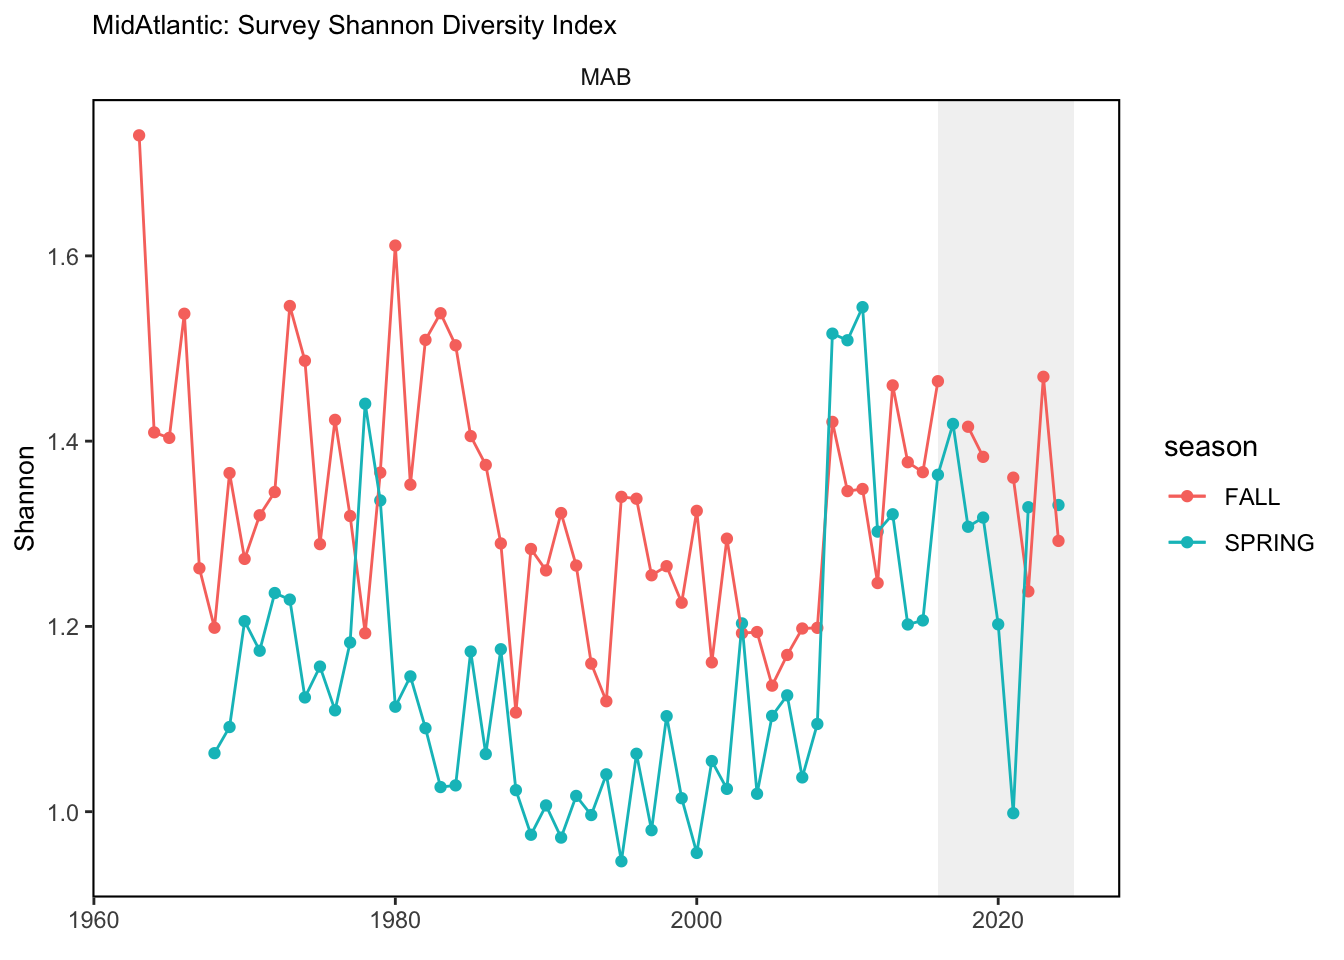
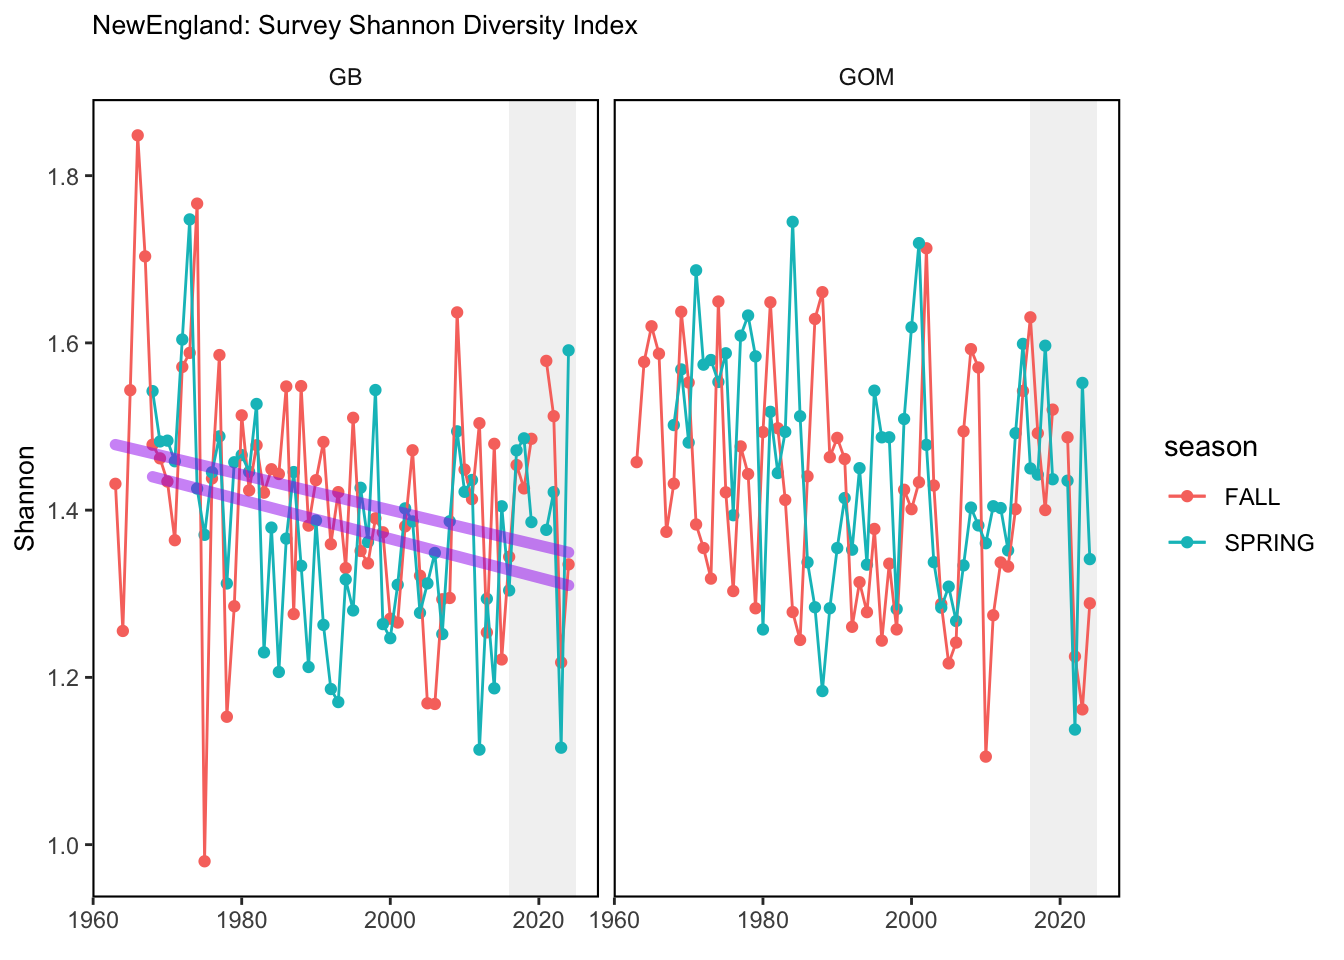
The Shannon index, \(H^\prime\), was calculated for each Ecological Production Unit (EPU) annually after determining the set of stations surveyed and assigning them to the appropriate EPU.
2.1.4 Are indicator underlying source data linked or easy to find?
Source data are available to qualified researchers upon request (see “Access Information” here).
2.1.4.1 Where are source data stored?
survdat is an R package that allows for queries of the NEFSC survey database (SVDBS).These data are available to qualified researchers upon request. More information on the data request process is available under the “Access Information” field here.
2.1.4.2 How/by whom are source data updated? Are future updates likely?
Andy Beet andrew.beet@noaa.gov
[likelihood of source data updates requires judgement, enter by hand]
2.2 Indicator analysis/testing or history of use
2.2.1 What decision or advice processes are the indicators currently used in?
Diversity metrics may be useful in determining shifts in species composition through time. The shannon-diversity index, a way to measure diversity using species richness and evenness is implemented in the attempt to determine changes over time. The index has a maximum value when all species are equally abundant.
2.2.2 What implications of the indicators are currently listed?
A decline in the shannon diversity index over time could be a result of several factors; a decline in the number of species being found in the system over time or a select few becoming more abundant (relative to the rest) over time. If the number of species remain contant through time, then the decline represents a shift to a more unbalanced, uneven system where some species are more abundannt that others. An increase would represent the opposite, a shift, in direction, to a more balanced, even system. If the number of species is changing through time, the inference is more complicated since the maximum value of the shannon-index is a function of the number of species.
2.2.4 Have the indicators been tested to ensure they respond proportionally to a change in the underlying process?
No
3 SMART rating
Category | Indicator | Element | Attribute | Rating | ElementRating | OverallRating |
|---|---|---|---|---|---|---|
Fish | Bottom trawl survey diversity index | Specific | Described | 1 | 0.6666667 | 0.6666667 |
Fish | Bottom trawl survey diversity index | Specific | Units | 1 | 0.6666667 | 0.6666667 |
Fish | Bottom trawl survey diversity index | Specific | Spatial | 1 | 0.6666667 | 0.6666667 |
Fish | Bottom trawl survey diversity index | Specific | Uncertainty | 0 | 0.6666667 | 0.6666667 |
Fish | Bottom trawl survey diversity index | Specific | Methods | 1 | 0.6666667 | 0.6666667 |
Fish | Bottom trawl survey diversity index | Specific | Code | 0 | 0.6666667 | 0.6666667 |
Fish | Bottom trawl survey diversity index | Measurable | Available | 1 | 1.0000000 | 0.6666667 |
Fish | Bottom trawl survey diversity index | Measurable | Online | 1 | 1.0000000 | 0.6666667 |
Fish | Bottom trawl survey diversity index | Measurable | Contact | 1 | 1.0000000 | 0.6666667 |
Fish | Bottom trawl survey diversity index | Measurable | SourceDat | 1 | 1.0000000 | 0.6666667 |
Fish | Bottom trawl survey diversity index | Measurable | SourceAvail | 1 | 1.0000000 | 0.6666667 |
Fish | Bottom trawl survey diversity index | Measurable | SourceContact | 1 | 1.0000000 | 0.6666667 |
Fish | Bottom trawl survey diversity index | Achievable | Tested | 0 | 0.0000000 | 0.6666667 |
Fish | Bottom trawl survey diversity index | Achievable | Sensitivity | 0 | 0.0000000 | 0.6666667 |
Fish | Bottom trawl survey diversity index | Achievable | TimeLag | 0 | 0.0000000 | 0.6666667 |
Fish | Bottom trawl survey diversity index | Relevant | Advice | 1 | 0.6666667 | 0.6666667 |
Fish | Bottom trawl survey diversity index | Relevant | Implications | 1 | 0.6666667 | 0.6666667 |
Fish | Bottom trawl survey diversity index | Relevant | TargThresh | 0 | 0.6666667 | 0.6666667 |
Fish | Bottom trawl survey diversity index | Timebound | Frequency | 1 | 1.0000000 | 0.6666667 |
Fish | Bottom trawl survey diversity index | Timebound | Updated | 1 | 1.0000000 | 0.6666667 |
3.1 Comments
[Fill below by hand once above data complete]
3.1.1 Additional potential links to management in addition to uses listed above
3.1.2 What additional work would be needed for the Council to use the indicator?
3.1.3 What issues are caused if there is a gap or delay in data underlying the indicator