SMART Indicator Report: Bottom temperature - Seasonal Gridded
1 Descriptive Section
1.2 Indicator name
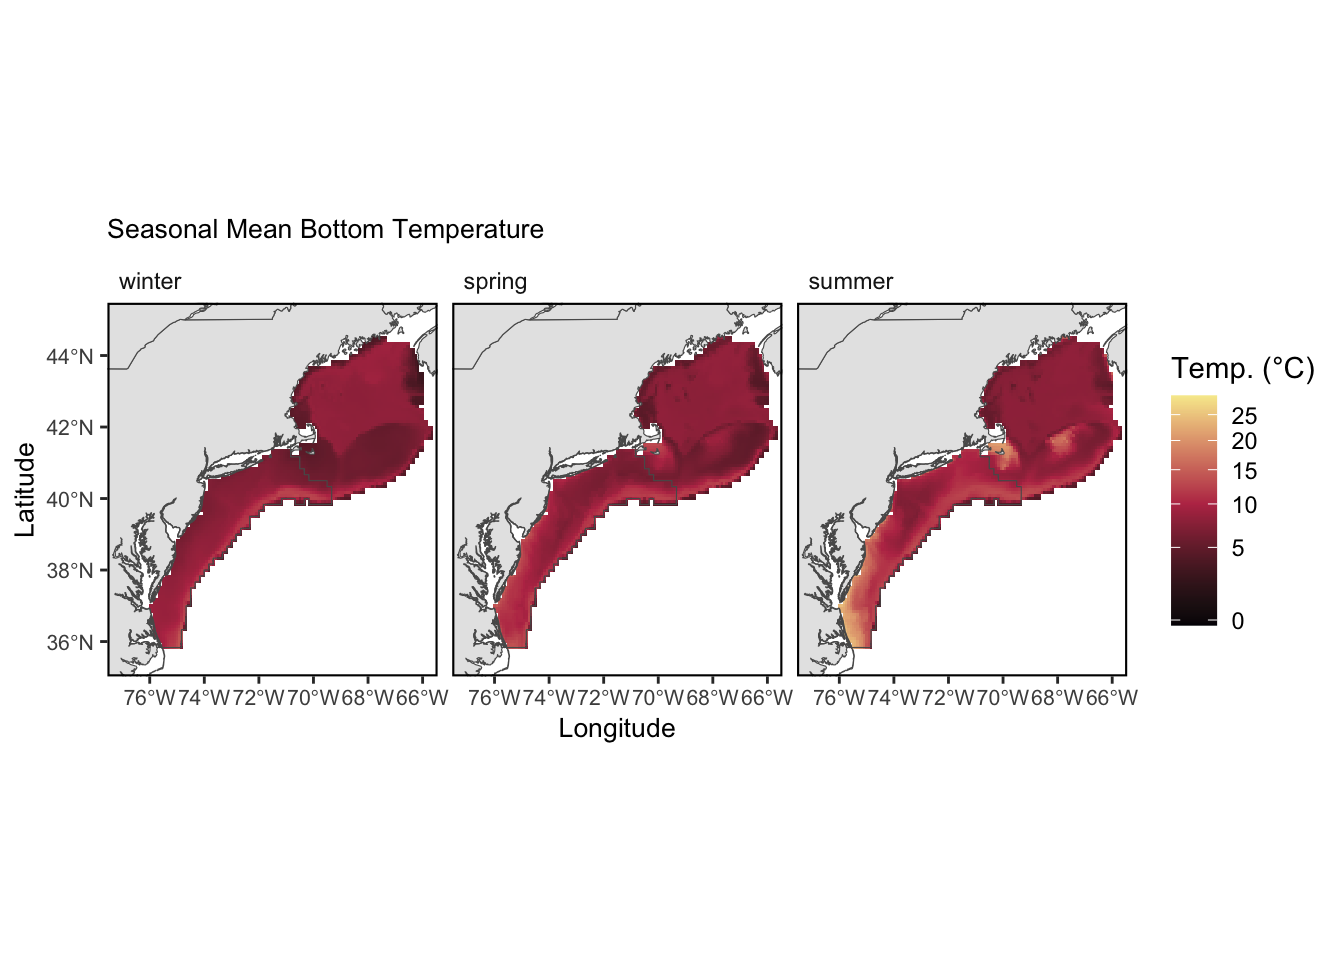
Bottom temperature - Seasonal Gridded
Includes variable(s): fall, spring, summer, winter
2 SMART Attribute Section
2.1 Indicator documentation
2.1.1 Are indicators available for others to use (data downloadable)?
Yes
2.1.1.1 Where can indicators be found?
Data: https://noaa-edab.github.io/ecodata/index.html
Description: https://noaa-edab.github.io/catalog/bottom_temp_model_gridded.html
Technical documentation: https://noaa-edab.github.io/tech-doc/bottom_temp_model_gridded.html
2.1.1.2 How often are they updated? Are future updates likely?
[need sequential look at datasets for update frequency. Future requires judgement]
2.1.2 Gather indicator statistics
2.1.2.1 Units
Indicator | Units |
|---|---|
fall | no Units field |
spring | no Units field |
summer | no Units field |
winter | no Units field |
2.1.2.2 Length of time series, start and end date, periodicity
General overview: Winter (Jan-Mar), Spring (April-June), Summer (July-Sept), Fall (Oct - Dec) from 1959-2024
Indicator specifics:
Indicator | EPU | StartYear | EndYear | NumYears | MissingYears |
|---|---|---|---|---|---|
fall | no EPU field | 1959 | 2023 | 65 | 0 |
spring | no EPU field | 1959 | 2024 | 66 | 0 |
summer | no EPU field | 1959 | 2024 | 66 | 0 |
winter | no EPU field | 1959 | 2024 | 66 | 0 |
2.1.2.3 Spatial location, scale and extent
General overview: Whole shelf
Indicator specifics:
Indicator | EPU |
|---|---|
fall | no EPU field |
spring | no EPU field |
summer | no EPU field |
winter | no EPU field |
2.1.4 Are indicator underlying source data linked or easy to find?
Source data are NOT publicly available. Please email hubert.dupontavice@noaa.gov for further information and queries of bottom temperature source data.
2.1.4.1 Where are source data stored?
The bottom temperature product covered the northeast U.S. shelf marine ecosystem (NEUS) and specifically an area of four Ecological Production Units (EPUs) defined by NOAA’s Northeast Fisheries Science Center (https://noaa-edab.github.io/tech-doc/epu.html). The bottom temperature product is in a horizontal 1/12 degree grid between 1959 and 2022 and is made of daily bottom temperature estimates from: Bias-corrected ROMS-NWA (ROMScor) between 1959 and 1992 which was regridded in the same 1/12degree grid as GLORYS using bilinear interpolation; GLORYS12v1 in its original 1/12 degree grid between 1993 and 2020; GLO12v3 (called PSY4V3R1 in “A High-Resolution Ocean Bottom Temperature Product for the Northeast U.S. Continental Shelf Marine Ecosystem” (2023) and Lellouche et al. (2018) in its original 1/12 degree grid for 2021. GLO12v4 in its original 1/12 degree grid for 2022. Four ocean models were used to get high-resolution daily bottom temperature on the NEUS between 1959 and 2022. For the period between 1959 and 1992, we used daily ocean bottom temperature from the long-term (1958–2007) high-resolution numerical simulation of the Northwest Atlantic Ocean in the Regional Ocean Modelling System (ROMS), a split-explicit, free-surface, terrain-following, hydrostatic, primitive equation model (Shchepetkin and McWilliams (2005)). The model domain covers the Northwest Atlantic Ocean with ~7km horizontal resolution and 40 vertical terrain- following layers. A detailed description of ROMS-NWA can be found in Chen et al. (2018). For the period between 1992 and 2020, the daily bottom temperature outputs from the GLORYS12v1 ocean reanalysis product were used. GLORYS12v1 is a global ocean, eddy-resolving, and data assimilated hindcast from Mercator Ocean (European Union-Copernicus Marine Service, 2018; Lellouche et al. (2018); Jean-Michel et al. (2021)) with 1/12 degree horizontal resolution and 50 vertical levels. The base ocean model is the Nucleus for European Modelling of the Ocean 3.1 (NEMO 3.1; Madec, 2016) driven at the surface by the European Centre for the Medium-Range Weather Forecasts (ECMWF) ERA-Interim reanalysis (Dee et al. (2011)). Remotely sensed and in situ observations are jointly assimilated by means of a reduced-order Kalman filter. For the years 2021 and 2022, we used GLO12v4 which is a revised and updated version of GLO12v3 (European Union-Copernicus Marine Service, 2016). The general model structure is similar to GLO12v3 with some changes in model configuration, parameterizations, relaxations to avoid spurious drifts, river inputs, atmospheric fluxes and data assimilation (more detail in https://data.marine.copernicus.eu/product/GLOBAL_ANALYSISFORECAST_PHY_001_024/description) We used the methodology presented in du Pontavice et al. (2023) based on the Northwest Atlantic Regional Ocean Climatology (NWARC). The first step was to regrid ROMS-NWA bottom temperature over the same 1/10 degree horizontal grid as the NWARC using bilinear interpolation. Then, we conducted the bottom temperature bias-correction in the 1/10 degree NWARC grid using monthly climatologies from NWARC over four decadal periods from 1955 to 1994. A monthly bias was calculated in each 1/10 degree grid cell and for each decade (1955–1964, 1965–1974, 1975–1984, 1985–1994). Based on this monthly bias, we estimated a daily bias for each decade in each grid cell. Lastly, for each ROMS-NWA grid cell we identified the bias from the closest 1/10 degree NWARC grid cell and subtracted the daily bias to the daily ROMS-NWA bottom temperature for all years and days of each decade.
2.1.4.2 How/by whom are source data updated? Are future updates likely?
Joe Caracappa, joseph.caracappa@noaa.gov
[likelihood of source data updates requires judgement, enter by hand]
2.2 Indicator analysis/testing or history of use
2.2.1 What decision or advice processes are the indicators currently used in?
The bottom temperature product is in a horizontal 1/12 degree grid between 1959 and 2024 and is made of daily bottom temperature estimates from: Bias-corrected ROMS-NWA between 1959 and 1992 which was regridded in the same 1/12degree grid as GLORYS using bilinear interpolation; Years 1993 through fall 2024 are from CMEMS GLORYS12V1 global reanalysis bottom temperature.
2.2.2 What implications of the indicators are currently listed?
Bottom temperature is a key environmental parameter in defining the habitat and metabolic conditions of demersal and benthic species. Interannual and seasonal changes in bottom temperature can provide significant indicators of species productivity, spatial distributions, or mortality. Long-term trends in bottom temperature are indicators of regional implications of global climate change and may be used in evaluating climate risk for fisheries management.
2.2.4 Have the indicators been tested to ensure they respond proportionally to a change in the underlying process?
Simulation or test terms detected
3 SMART rating
Category | Indicator | Element | Attribute | Rating | ElementRating | OverallRating |
|---|---|---|---|---|---|---|
Habitat-Physical | Bottom temperature - Seasonal Gridded | Specific | Described | 1 | 0.5000000 | 0.6666667 |
Habitat-Physical | Bottom temperature - Seasonal Gridded | Specific | Units | 0 | 0.5000000 | 0.6666667 |
Habitat-Physical | Bottom temperature - Seasonal Gridded | Specific | Spatial | 1 | 0.5000000 | 0.6666667 |
Habitat-Physical | Bottom temperature - Seasonal Gridded | Specific | Uncertainty | 0 | 0.5000000 | 0.6666667 |
Habitat-Physical | Bottom temperature - Seasonal Gridded | Specific | Methods | 1 | 0.5000000 | 0.6666667 |
Habitat-Physical | Bottom temperature - Seasonal Gridded | Specific | Code | 0 | 0.5000000 | 0.6666667 |
Habitat-Physical | Bottom temperature - Seasonal Gridded | Measurable | Available | 1 | 0.8333333 | 0.6666667 |
Habitat-Physical | Bottom temperature - Seasonal Gridded | Measurable | Online | 1 | 0.8333333 | 0.6666667 |
Habitat-Physical | Bottom temperature - Seasonal Gridded | Measurable | Contact | 1 | 0.8333333 | 0.6666667 |
Habitat-Physical | Bottom temperature - Seasonal Gridded | Measurable | SourceDat | 0 | 0.8333333 | 0.6666667 |
Habitat-Physical | Bottom temperature - Seasonal Gridded | Measurable | SourceAvail | 1 | 0.8333333 | 0.6666667 |
Habitat-Physical | Bottom temperature - Seasonal Gridded | Measurable | SourceContact | 1 | 0.8333333 | 0.6666667 |
Habitat-Physical | Bottom temperature - Seasonal Gridded | Achievable | Tested | 1 | 0.3333333 | 0.6666667 |
Habitat-Physical | Bottom temperature - Seasonal Gridded | Achievable | Sensitivity | 0 | 0.3333333 | 0.6666667 |
Habitat-Physical | Bottom temperature - Seasonal Gridded | Achievable | TimeLag | 0 | 0.3333333 | 0.6666667 |
Habitat-Physical | Bottom temperature - Seasonal Gridded | Relevant | Advice | 1 | 0.6666667 | 0.6666667 |
Habitat-Physical | Bottom temperature - Seasonal Gridded | Relevant | Implications | 1 | 0.6666667 | 0.6666667 |
Habitat-Physical | Bottom temperature - Seasonal Gridded | Relevant | TargThresh | 0 | 0.6666667 | 0.6666667 |
Habitat-Physical | Bottom temperature - Seasonal Gridded | Timebound | Frequency | 1 | 1.0000000 | 0.6666667 |
Habitat-Physical | Bottom temperature - Seasonal Gridded | Timebound | Updated | 1 | 1.0000000 | 0.6666667 |
3.1 Comments
[Fill below by hand once above data complete]
3.1.1 Additional potential links to management in addition to uses listed above
3.1.2 What additional work would be needed for the Council to use the indicator?
3.1.3 What issues are caused if there is a gap or delay in data underlying the indicator