SMART Indicator Report: Bottom Temperature - in situ
1 Descriptive Section
1.2 Indicator name
Bottom Temperature - in situ
Includes variable(s): bottom temp anomaly in situ, reference bt in situ (1981-2010), reference sst in situ (1981-2010), sst anomaly in situ
2 SMART Attribute Section
2.1 Indicator documentation
2.1.1 Are indicators available for others to use (data downloadable)?
Yes
2.1.1.1 Where can indicators be found?
Data: https://noaa-edab.github.io/ecodata/index.html
Description: https://noaa-edab.github.io/catalog/bottom_temp_insitu.html
Technical documentation: https://noaa-edab.github.io/tech-doc/bottom_temp_insitu.html
2.1.1.2 How often are they updated? Are future updates likely?
[need sequential look at datasets for update frequency. Future requires judgement]
2.1.2 Gather indicator statistics
2.1.2.1 Units
Indicator | Units |
|---|---|
bottom temp anomaly in situ | degreesC |
reference bt in situ (1981-2010) | degreesC |
reference sst in situ (1981-2010) | degreesC |
sst anomaly in situ | degreesC |
2.1.2.2 Length of time series, start and end date, periodicity
General overview: Annual
Indicator specifics:
Indicator | EPU | StartYear | EndYear | NumYears | MissingYears |
|---|---|---|---|---|---|
bottom temp anomaly in situ | GB | 1977 | 2023 | 46 | 1 |
bottom temp anomaly in situ | GOM | 1977 | 2023 | 43 | 4 |
bottom temp anomaly in situ | MAB | 1977 | 2023 | 43 | 4 |
bottom temp anomaly in situ | SS | 1977 | 2023 | 41 | 6 |
reference bt in situ (1981-2010) | GB | 1977 | 2023 | 46 | 1 |
reference bt in situ (1981-2010) | GOM | 1977 | 2023 | 43 | 4 |
reference bt in situ (1981-2010) | MAB | 1977 | 2023 | 43 | 4 |
reference bt in situ (1981-2010) | SS | 1977 | 2023 | 41 | 6 |
reference sst in situ (1981-2010) | GB | 1977 | 2023 | 46 | 1 |
reference sst in situ (1981-2010) | GOM | 1977 | 2023 | 43 | 4 |
reference sst in situ (1981-2010) | MAB | 1977 | 2023 | 43 | 4 |
reference sst in situ (1981-2010) | SS | 1977 | 2023 | 43 | 4 |
sst anomaly in situ | GB | 1977 | 2023 | 46 | 1 |
sst anomaly in situ | GOM | 1977 | 2023 | 43 | 4 |
sst anomaly in situ | MAB | 1977 | 2023 | 43 | 4 |
sst anomaly in situ | SS | 1977 | 2023 | 43 | 4 |
2.1.2.3 Spatial location, scale and extent
General overview: by EPU
Indicator specifics:
Indicator | EPU |
|---|---|
bottom temp anomaly in situ | GB |
bottom temp anomaly in situ | GOM |
bottom temp anomaly in situ | MAB |
bottom temp anomaly in situ | SS |
reference bt in situ (1981-2010) | GB |
reference bt in situ (1981-2010) | GOM |
reference bt in situ (1981-2010) | MAB |
reference bt in situ (1981-2010) | SS |
reference sst in situ (1981-2010) | GB |
reference sst in situ (1981-2010) | GOM |
reference sst in situ (1981-2010) | MAB |
reference sst in situ (1981-2010) | SS |
sst anomaly in situ | GB |
sst anomaly in situ | GOM |
sst anomaly in situ | MAB |
sst anomaly in situ | SS |
2.1.3 Are methods clearly documented to obtain source data and calculate indicators?
Yes
2.1.3.1 Can the indicator be calculated from current documentation?
While all processed hydrographic data are archived in an Oracle database (OCDBS), we work from Matlab-formatted files stored locally.
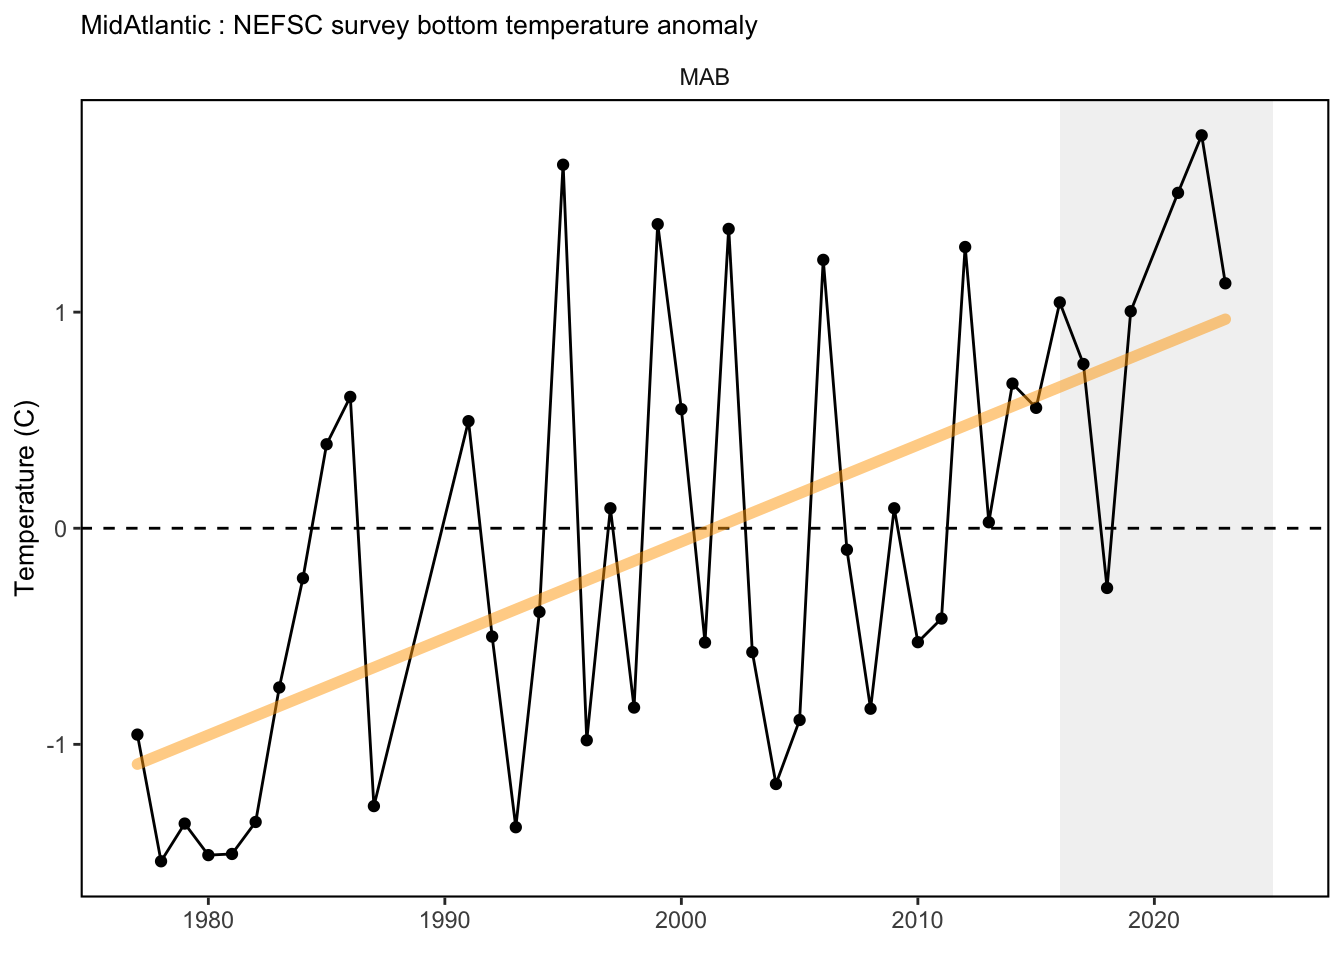
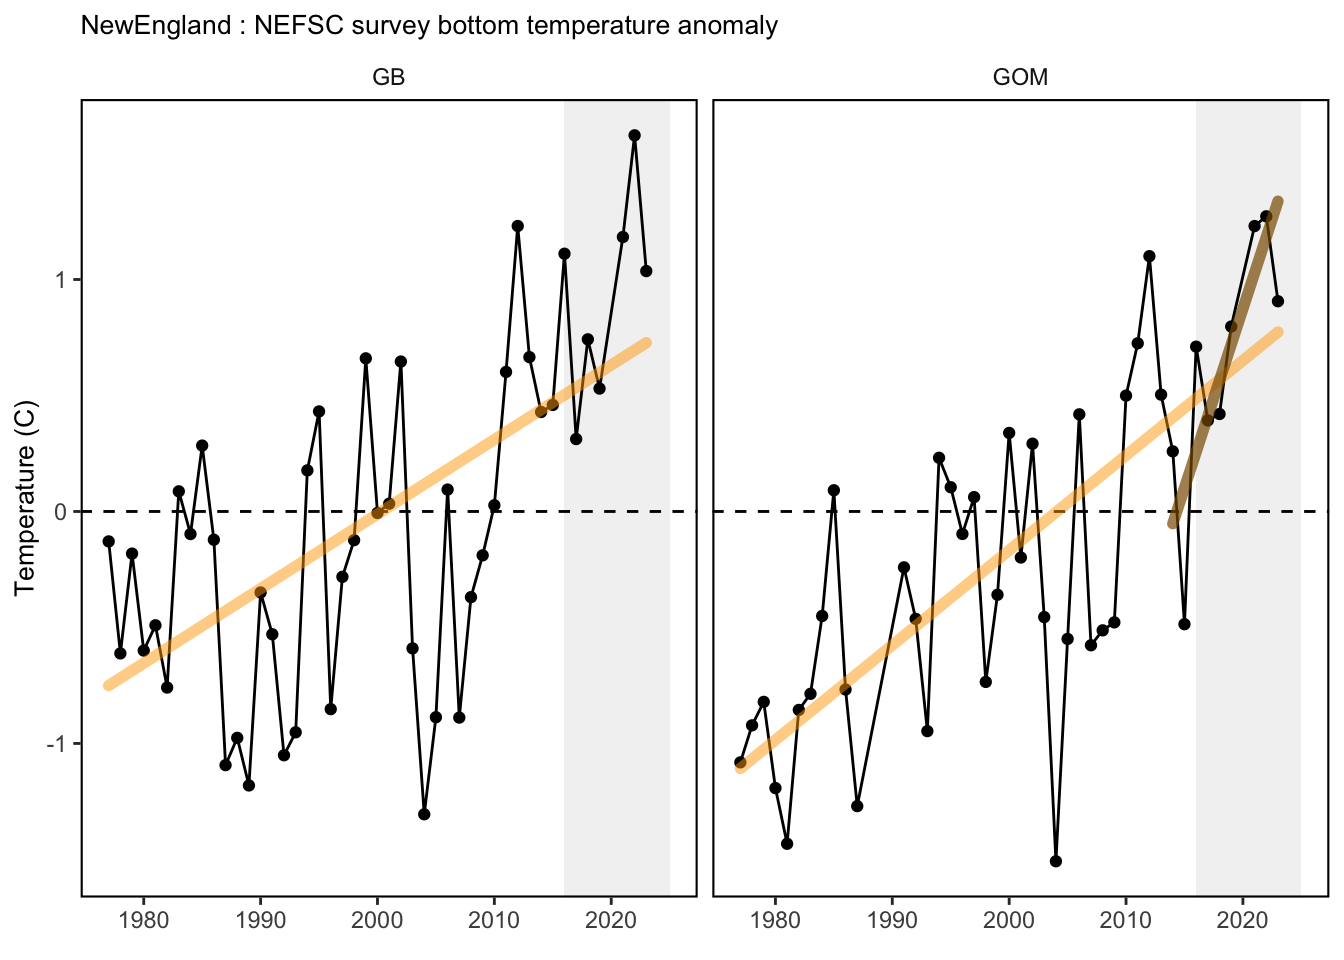
Ocean temperature on the Northeast U.S. Shelf varies significantly on seasonal timescales. Any attempt to resolve year-to-year changes requires that this seasonal variability be quantified and removed to avoid bias. This process is complicated by the fact that NEFSC hydrographic surveys conform to a random stratified sampling design meaning that stations are not repeated at fixed locations year after year so that temperature variability cannot be assessed at fixed station locations. Instead, we consider the variation of the average bottom temperature within four Ecological Production Units (EPUs): Mid-Atlantic Bight, Georges Bank, Gulf of Maine and Scotian Shelf. Within each EPU, ocean temperature observations are extracted from the collection of measurements made within 10 m of the bottom on each survey and an area-weighted average temperature is calculated. The result of this calculation is a time series of regional average near-bottom temperature having a temporal resolution that matches the survey frequency in the database. Anomalies are subsequently calculated relative to a reference annual cycle, estimated using a multiple linear regression model to fit an annual harmonic (365-day period) to historical regional average temperatures from 1977-present. The curve fitting technique to formulate the reference annual cycle follows the methodologies outlined by Mountain (1991). The resulting anomaly time series represents the difference between the time series of regional mean temperatures and corresponding reference temperatures predicted by a reference annual cycle for the same time of year. Finally, a reference annual average temperature (calculated as the average across the reference annual cycle) is also provided and can be added back into the anomaly time series to convert temperature anomalies to ocean bottom temperature.
2.1.4 Are indicator underlying source data linked or easy to find?
Source data are publicly available at ftp://ftp.nefsc.noaa.gov/pub/hydro/matlab_files/yearly and in the World Ocean Database housed at http://www.nodc.noaa.gov/OC5/SELECT/dbsearch/dbsearch.html under institute code number 258.
2.1.4.1 Where are source data stored?
The bottom temperature index incorporates near-bottom temperature measurements collected on Northeast Fisheries Science Center (NEFSC) surveys between 1977-present. Early measurements were made using surface bucket samples, mechanical bathythermographs and expendable bathythermograph probes, but by 1991 the CTD – an acronym for conductivity temperature and depth – became standard equipment on all NEFSC surveys. Near-bottom refers to the deepest observation at each station that falls within 10 m of the reported water depth. Observations encompass the entire continental shelf area extending from Cape Hatteras, NC to Nova Scotia, Canada, inclusive of the Gulf of Maine and Georges Bank. Source data are publicly available at https://comet.nefsc.noaa.gov/erddap/tabledap/ocdbs_v_erddap1.html
2.1.4.2 How/by whom are source data updated? Are future updates likely?
Kimberly Bastille, kimberly.bastille@noaa.gov
[likelihood of source data updates requires judgement, enter by hand]
2.2 Indicator analysis/testing or history of use
2.2.1 What decision or advice processes are the indicators currently used in?
The bottom temperature index incorporates near-bottom temperature measurements collected on Northeast Fisheries Science Center (NEFSC) surveys between 1977-present. Early measurements were made using surface bucket samples, mechanical bathythermographs and expendable bathythermograph probes, but by 1991 the CTD – an acronym for conductivity temperature and depth – became standard equipment on all NEFSC surveys. Near-bottom refers to the deepest observation at each station that falls within 10 m of the reported water depth. Observations encompass the entire continental shelf area extending from Cape Hatteras, NC to Nova Scotia, Canada, inclusive of the Gulf of Maine and Georges Bank.
2.2.4 Have the indicators been tested to ensure they respond proportionally to a change in the underlying process?
No
3 SMART rating
Category | Indicator | Element | Attribute | Rating | ElementRating | OverallRating |
|---|---|---|---|---|---|---|
Habitat-Physical | Bottom Temperature - in situ | Specific | Described | 1.0 | 0.6666667 | 0.6166667 |
Habitat-Physical | Bottom Temperature - in situ | Specific | Units | 1.0 | 0.6666667 | 0.6166667 |
Habitat-Physical | Bottom Temperature - in situ | Specific | Spatial | 1.0 | 0.6666667 | 0.6166667 |
Habitat-Physical | Bottom Temperature - in situ | Specific | Uncertainty | 0.0 | 0.6666667 | 0.6166667 |
Habitat-Physical | Bottom Temperature - in situ | Specific | Methods | 1.0 | 0.6666667 | 0.6166667 |
Habitat-Physical | Bottom Temperature - in situ | Specific | Code | 0.0 | 0.6666667 | 0.6166667 |
Habitat-Physical | Bottom Temperature - in situ | Measurable | Available | 1.0 | 1.0000000 | 0.6166667 |
Habitat-Physical | Bottom Temperature - in situ | Measurable | Online | 1.0 | 1.0000000 | 0.6166667 |
Habitat-Physical | Bottom Temperature - in situ | Measurable | Contact | 1.0 | 1.0000000 | 0.6166667 |
Habitat-Physical | Bottom Temperature - in situ | Measurable | SourceDat | 1.0 | 1.0000000 | 0.6166667 |
Habitat-Physical | Bottom Temperature - in situ | Measurable | SourceAvail | 1.0 | 1.0000000 | 0.6166667 |
Habitat-Physical | Bottom Temperature - in situ | Measurable | SourceContact | 1.0 | 1.0000000 | 0.6166667 |
Habitat-Physical | Bottom Temperature - in situ | Achievable | Tested | 0.0 | 0.0000000 | 0.6166667 |
Habitat-Physical | Bottom Temperature - in situ | Achievable | Sensitivity | 0.0 | 0.0000000 | 0.6166667 |
Habitat-Physical | Bottom Temperature - in situ | Achievable | TimeLag | 0.0 | 0.0000000 | 0.6166667 |
Habitat-Physical | Bottom Temperature - in situ | Relevant | Advice | 1.0 | 0.6666667 | 0.6166667 |
Habitat-Physical | Bottom Temperature - in situ | Relevant | Implications | 1.0 | 0.6666667 | 0.6166667 |
Habitat-Physical | Bottom Temperature - in situ | Relevant | TargThresh | 0.0 | 0.6666667 | 0.6166667 |
Habitat-Physical | Bottom Temperature - in situ | Timebound | Frequency | 1.0 | 0.7500000 | 0.6166667 |
Habitat-Physical | Bottom Temperature - in situ | Timebound | Updated | 0.5 | 0.7500000 | 0.6166667 |
3.1 Comments
[Fill below by hand once above data complete]
3.1.1 Additional potential links to management in addition to uses listed above
3.1.2 What additional work would be needed for the Council to use the indicator?
3.1.3 What issues are caused if there is a gap or delay in data underlying the indicator