SMART Indicator Report: Arctic Oscillation Index
1 Descriptive Section
1.3 Indicator brief description
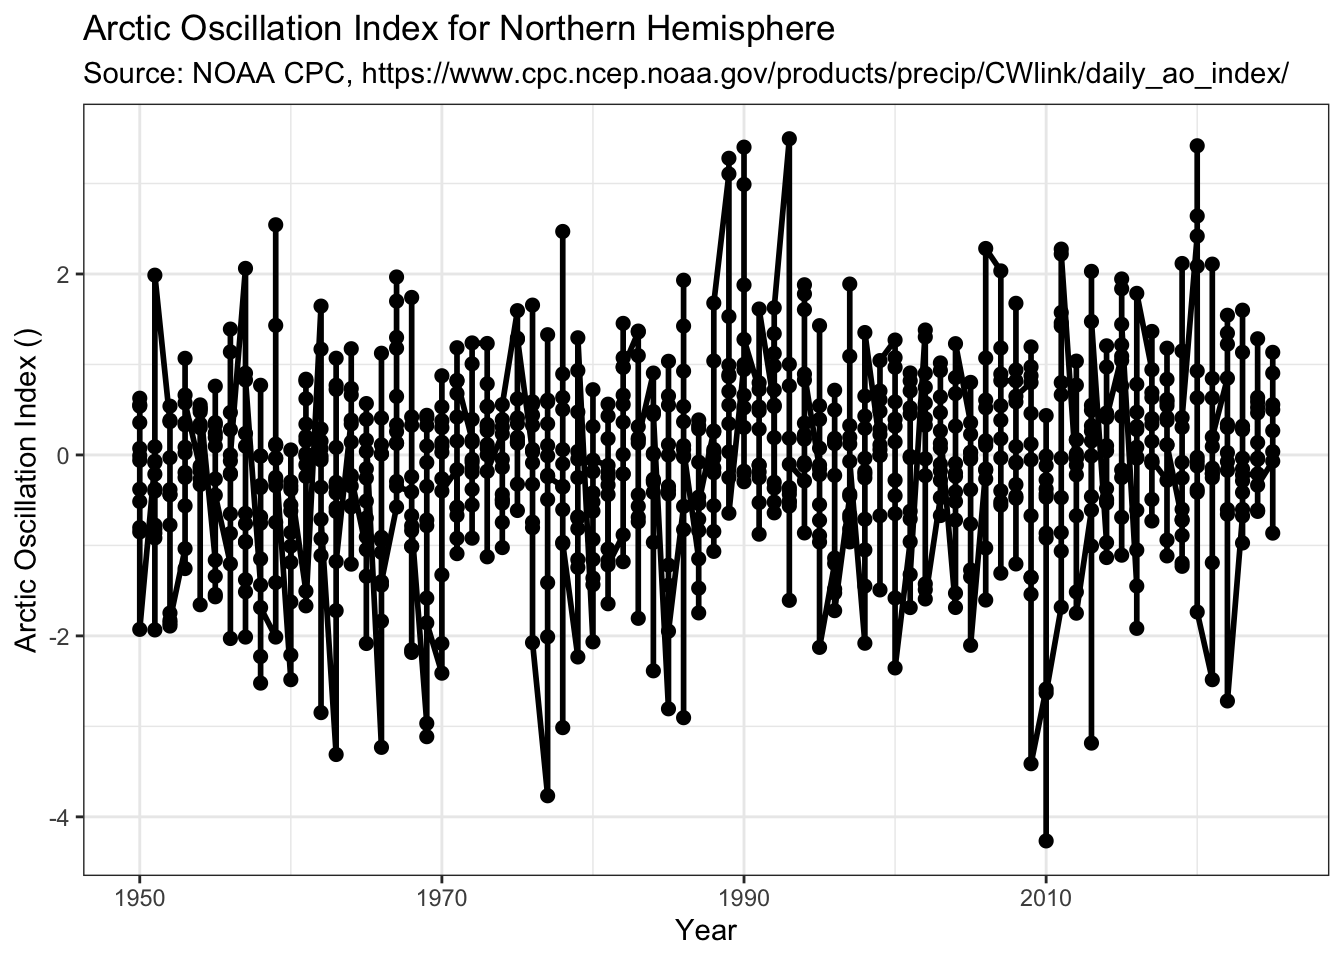
The Arctic Oscillation Index (AO) describes changing patterns over time of atmospheric pressure around the North Pole that affect the location of the mid-latitude Jet Stream. The indicator focuses on annual changes in winter AO by averaging monthly NAO indices for January, February, and March each year.
1.4 Indicator visualization
The winter AO has oscillated since 1950 between negative (higher Arctic pressure and weak winds allow Arctic air deeper into mid-latitudes) and positive (lower Arctic pressure and strong winds keep Arctic air in the Arctic) phases at 20-30 year intervals. It has been neutral or positive since 2014 and trended toward neutral in 2025.
2 SMART Attribute Section
2.1 Indicator documentation
2.1.1 Are indicators available for others to use (data downloadable)?
Yes
2.1.1.1 Where can indicators be found?
All marea indicators are here: https://github.com/MarEcosystemApproaches/marea
2.1.1.3 Who is the contact?
Jamie C. Tam jamie.tam@dfo-mpo.gc.ca
2.1.2 Gather indicator statistics
2.1.2.2 Length of time series, start and end date, periodicity
General overview: Annual and Monthly
Indicator specifics:
Indicator | EPU | StartYear | EndYear |
|---|---|---|---|
Arctic Oscillation Index | Northern Hemisphere | 1950 | 2025 |
2.1.2.3 Spatial location, scale and extent
General overview: AO PCA
Indicator specifics:
Indicator | EPU |
|---|---|
Arctic Oscillation Index | Northern Hemisphere |
2.1.3 Are methods clearly documented to obtain source data and calculate indicators?
No methods documentation is provided
2.1.3.1 Can the indicator be calculated from current documentation?
No. No methods documentation is provided
2.1.3.3 Have methods changed over time?
Unclear, but the link below in the marea metadata has been replaced: https://www.cpc.ncep.noaa.gov/products/precip/CWlink/daily_ao_index/ao.shtml
2.1.4 Are indicator underlying source data linked or easy to find?
Yes. Source information included: NOAA CPC, https://www.cpc.ncep.noaa.gov/products/precip/CWlink/daily_ao_index/
2.1.4.1 Where are source data stored?
Source data stored at NOAA CPC, https://www.cpc.ncep.noaa.gov/products/precip/CWlink/daily_ao_index/
2.2 Indicator analysis/testing or history of use
2.2.2 What implications of the indicators are currently listed?
The positive phase of the AO generally means a more northerly jet stream that results in fewer cold weather conditions in the Mid-Atlantic. The negative phase can push the jet stream further south, bringing Arctic air into the northeast US and resulting in more Nor’easters. See https://www.climate.gov/news-features/understanding-climate/climate-variability-arctic-oscillation
2.2.4 Have the indicators been tested to ensure they respond proportionally to a change in the underlying process?
Yes, the NOAA National Weather Service Climate Prediction Center routinely compares observed daily AO indices with forecast AO indices. See https://www.cpc.ncep.noaa.gov/products/precip/CWlink/daily_ao_index/ao_index_ensm.shtml
3 SMART rating
Category | Indicator | Element | Attribute | Rating | ElementRating | OverallRating |
|---|---|---|---|---|---|---|
Habitat-Physical | Arctic Oscillation Index | Specific | Described | 1 | 0.3333333 | 0.5666667 |
Habitat-Physical | Arctic Oscillation Index | Specific | Units | 0 | 0.3333333 | 0.5666667 |
Habitat-Physical | Arctic Oscillation Index | Specific | Spatial | 1 | 0.3333333 | 0.5666667 |
Habitat-Physical | Arctic Oscillation Index | Specific | Uncertainty | 0 | 0.3333333 | 0.5666667 |
Habitat-Physical | Arctic Oscillation Index | Specific | Methods | 0 | 0.3333333 | 0.5666667 |
Habitat-Physical | Arctic Oscillation Index | Specific | Code | 0 | 0.3333333 | 0.5666667 |
Habitat-Physical | Arctic Oscillation Index | Measurable | Available | 1 | 0.8333333 | 0.5666667 |
Habitat-Physical | Arctic Oscillation Index | Measurable | Online | 1 | 0.8333333 | 0.5666667 |
Habitat-Physical | Arctic Oscillation Index | Measurable | Contact | 1 | 0.8333333 | 0.5666667 |
Habitat-Physical | Arctic Oscillation Index | Measurable | SourceDat | 1 | 0.8333333 | 0.5666667 |
Habitat-Physical | Arctic Oscillation Index | Measurable | SourceAvail | 1 | 0.8333333 | 0.5666667 |
Habitat-Physical | Arctic Oscillation Index | Measurable | SourceContact | 0 | 0.8333333 | 0.5666667 |
Habitat-Physical | Arctic Oscillation Index | Achievable | Tested | 1 | 0.3333333 | 0.5666667 |
Habitat-Physical | Arctic Oscillation Index | Achievable | Sensitivity | 0 | 0.3333333 | 0.5666667 |
Habitat-Physical | Arctic Oscillation Index | Achievable | TimeLag | 0 | 0.3333333 | 0.5666667 |
Habitat-Physical | Arctic Oscillation Index | Relevant | Advice | 0 | 0.3333333 | 0.5666667 |
Habitat-Physical | Arctic Oscillation Index | Relevant | Implications | 1 | 0.3333333 | 0.5666667 |
Habitat-Physical | Arctic Oscillation Index | Relevant | TargThresh | 0 | 0.3333333 | 0.5666667 |
Habitat-Physical | Arctic Oscillation Index | Timebound | Frequency | 1 | 1.0000000 | 0.5666667 |
Habitat-Physical | Arctic Oscillation Index | Timebound | Updated | 1 | 1.0000000 | 0.5666667 |
3.1 Comments
3.1.1 Additional potential links to management in addition to uses listed above
[Select from list of management processes/actions using exact keywords]
3.1.2 What additional work would be needed for the Council to use the indicator?
[List current gaps in the indicator given the current or potentail uses listed above, what resources are needed?]
3.1.3 What issues are caused if there is a gap or delay in data underlying the indicator
[Link to management process/actions and their requirements]