SMART Indicator Report: Aquaculture Production
1 Descriptive Section
1.2 Indicator name
Aquaculture Production
Includes variable(s): Pieces, Production/Acre, Shellfish lease Acres
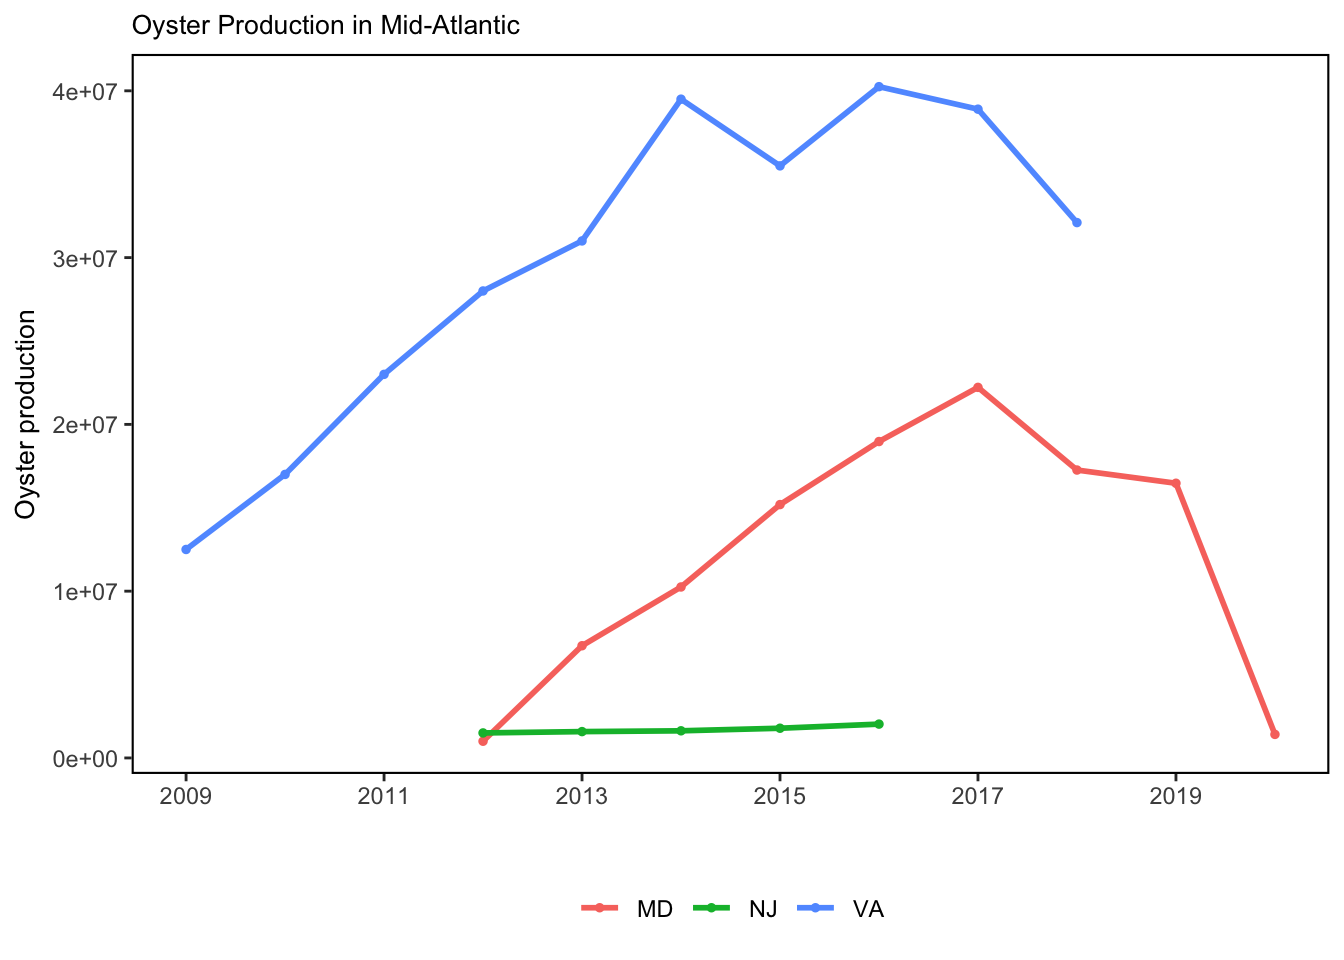
1.4 Indicator visualization
Overall, oyster production has generally increased and production per area has also improved. Aquaculture reporting is state specific, which can make it difficult to collate in a meaningful way. However, reporting coverage is improving year to year as aquaculture increases across the coast. The data included here only include oyster numbers at this time. Data after 2017 have decreased but, due to a lack of data from recent years, it is unclear if this has continued.
2 SMART Attribute Section
2.1 Indicator documentation
2.1.1 Are indicators available for others to use (data downloadable)?
Yes
2.1.1.1 Where can indicators be found?
Data: https://noaa-edab.github.io/ecodata/index.html
Description: https://noaa-edab.github.io/catalog/aquaculture.html
Technical documentation: https://noaa-edab.github.io/tech-doc/aquaculture.html
2.1.1.2 How often are they updated? Are future updates likely?
[need sequential look at datasets for update frequency. Future requires judgement]
2.1.1.3 Who is the contact?
Chris Schillaci christopher.schillaci@noaa.gov
2.1.2 Gather indicator statistics
2.1.2.1 Units
Indicator | Units |
|---|---|
Pieces | no Units field |
Production/Acre | no Units field |
Shellfish lease Acres | no Units field |
2.1.2.2 Length of time series, start and end date, periodicity
General overview: Annual
Indicator specifics:
Indicator | EPU | StartYear | EndYear | NumYears | MissingYears |
|---|---|---|---|---|---|
Pieces | no EPU field | 2009 | 2021 | 13 | 0 |
Production/Acre | no EPU field | 2009 | 2021 | 13 | 0 |
Shellfish lease Acres | no EPU field | 2009 | 2021 | 13 | 0 |
2.1.2.3 Spatial location, scale and extent
General overview: Mid Atlantic and New England
Indicator specifics:
Indicator | EPU |
|---|---|
Pieces | no EPU field |
Production/Acre | no EPU field |
Shellfish lease Acres | no EPU field |
2.1.4 Are indicator underlying source data linked or easy to find?
Source data are publicly available
2.1.4.1 Where are source data stored?
Data was synthesized from state specific sources, listed below. State of Maine, Department of Marine Resources. State of New Hampshire, Marine Aquaculture Compendium State of Massachusetts, Division of Marine Fisheries State of Rhode Island, Coastal Resource Management Council State of Maryland, Aquaculture Coordinating Council
2.1.4.2 How/by whom are source data updated? Are future updates likely?
Chris Schillaci christopher.schillaci@noaa.gov
[likelihood of source data updates requires judgement, enter by hand]
2.2 Indicator analysis/testing or history of use
2.2.1 What decision or advice processes are the indicators currently used in?
Aquaculture can produce seafood as well as other products. Here we summarize available data on aquaculture production from the Northeast US.
2.2.2 What implications of the indicators are currently listed?
Aquaculture production contributes to overall seafood production in the Northeast US. This indicator provides only a portion of aquaculture production in the region, but increases in this portion are apparent across the whole time series. Recent decreases (since 2017) may indicate a downward change in this aquaculture portion; however, there is not enough data from years following 2017 to indicate any significant decreasing trends.
2.2.4 Have the indicators been tested to ensure they respond proportionally to a change in the underlying process?
No
3 SMART rating
Category | Indicator | Element | Attribute | Rating | ElementRating | OverallRating |
|---|---|---|---|---|---|---|
Fishery | Aquaculture Production | Specific | Described | 1.0 | 0.5000000 | 0.5833333 |
Fishery | Aquaculture Production | Specific | Units | 0.0 | 0.5000000 | 0.5833333 |
Fishery | Aquaculture Production | Specific | Spatial | 1.0 | 0.5000000 | 0.5833333 |
Fishery | Aquaculture Production | Specific | Uncertainty | 0.0 | 0.5000000 | 0.5833333 |
Fishery | Aquaculture Production | Specific | Methods | 1.0 | 0.5000000 | 0.5833333 |
Fishery | Aquaculture Production | Specific | Code | 0.0 | 0.5000000 | 0.5833333 |
Fishery | Aquaculture Production | Measurable | Available | 1.0 | 1.0000000 | 0.5833333 |
Fishery | Aquaculture Production | Measurable | Online | 1.0 | 1.0000000 | 0.5833333 |
Fishery | Aquaculture Production | Measurable | Contact | 1.0 | 1.0000000 | 0.5833333 |
Fishery | Aquaculture Production | Measurable | SourceDat | 1.0 | 1.0000000 | 0.5833333 |
Fishery | Aquaculture Production | Measurable | SourceAvail | 1.0 | 1.0000000 | 0.5833333 |
Fishery | Aquaculture Production | Measurable | SourceContact | 1.0 | 1.0000000 | 0.5833333 |
Fishery | Aquaculture Production | Achievable | Tested | 0.0 | 0.0000000 | 0.5833333 |
Fishery | Aquaculture Production | Achievable | Sensitivity | 0.0 | 0.0000000 | 0.5833333 |
Fishery | Aquaculture Production | Achievable | TimeLag | 0.0 | 0.0000000 | 0.5833333 |
Fishery | Aquaculture Production | Relevant | Advice | 1.0 | 0.6666667 | 0.5833333 |
Fishery | Aquaculture Production | Relevant | Implications | 1.0 | 0.6666667 | 0.5833333 |
Fishery | Aquaculture Production | Relevant | TargThresh | 0.0 | 0.6666667 | 0.5833333 |
Fishery | Aquaculture Production | Timebound | Frequency | 1.0 | 0.7500000 | 0.5833333 |
Fishery | Aquaculture Production | Timebound | Updated | 0.5 | 0.7500000 | 0.5833333 |
3.1 Comments
[Fill below by hand once above data complete]
3.1.1 Additional potential links to management in addition to uses listed above
3.1.2 What additional work would be needed for the Council to use the indicator?
3.1.3 What issues are caused if there is a gap or delay in data underlying the indicator